Configure timeline widget visualization
You can specify what the overall presentation of information should be, for example whether they are displayed as image, text and timestamp or only HTML formatted text on the card.
If the widget configuration dialog box is not already open, do as follows:
If the widget is on a Grid layout dashboard, click the Menu icon
 in the top right-hand corner of the widget and select Settings.
If the widget is on a Fluid layout dashboard, on the floating toolbar for the widget, click the Settings icon:
.
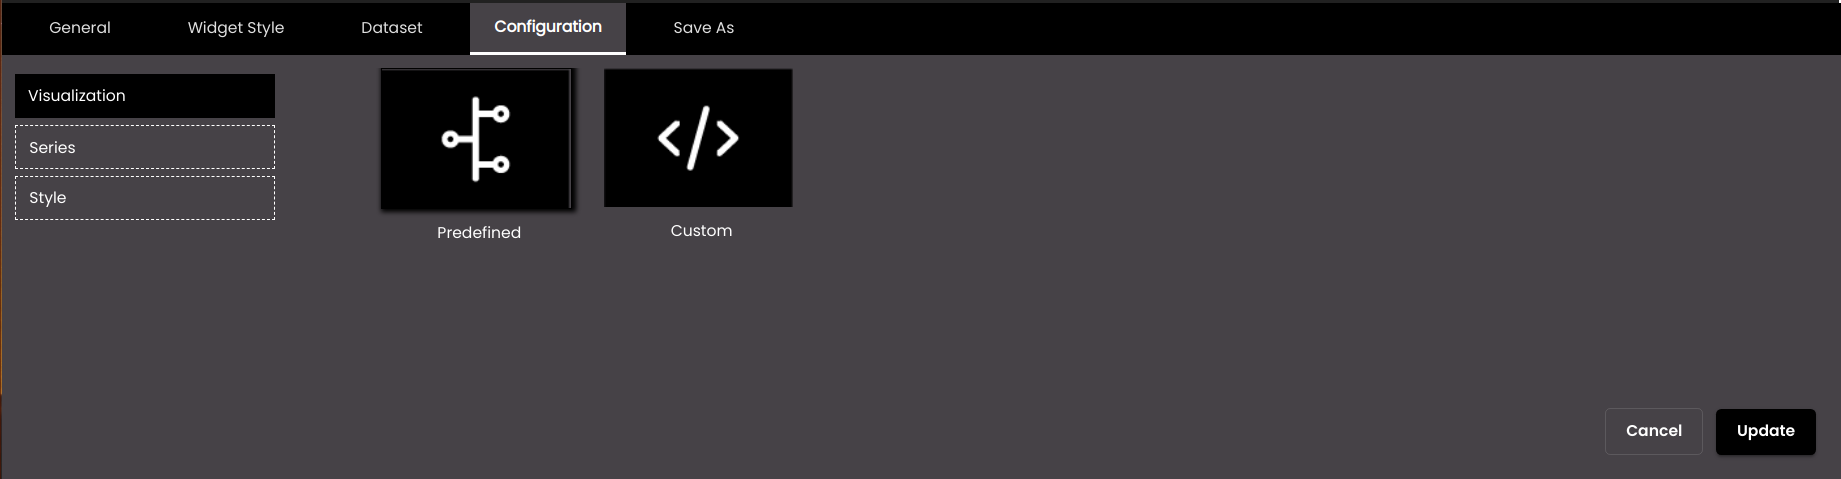
Click the Configuration tab.
On the left-hand side, click Visualization.
Select one of the options for visualizing information:
Setting
Description
Predefined
Displays a predefined data format of an image, text and timestamp on the card.

Custom
Displays data as HTML formatted text.
You can apply styles, alignments etc using the HTML tags. In order to refer to the dataset attributes, the syntax is
{point.column name}. For example, n order to display thedescriptioncolumn data of the dataset in the center of the card, the HTML code is as follows:<div style="text-align: center"> {point.description} </div>Click Save.