Chart widgets
Chart widgets are used to display information in the form of a graph, for example:
Charts are populated with data from CSV datasets, in which data is in tabular form. The information can be updated in response to events, either those at the dashboard level or those triggered by other widgets.
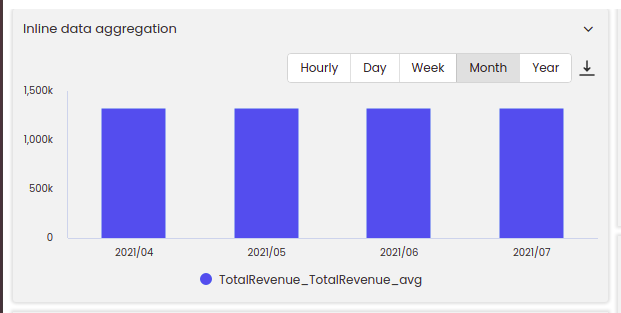
Inline Aggregation: Data can be aggregated hourly, daily, weekly, monthly, and yearly basis. Aggregation state is maintained between the normal and maximized nodes. The Aggregation option will be enabled only if it is accordingly configured in the dataset. For more information, see Configure chart widget filters.
Having added a chart widget to a dashboard, you need to perform some configuration of general settings and the dataset that is used to populate the widget with data, and also some further configuration that is specific to charts.
Note
The number of data points that can be viewed without any performance issues in the Charts widgets has been increased from 10,000 to 50,000. For better performance, the number of data points should be 50,000 or less.