Quantela Landing Page
Once you sign in successfully to the Quantela platform you will see the landing page with various features as shown below along with a brief description of each part.
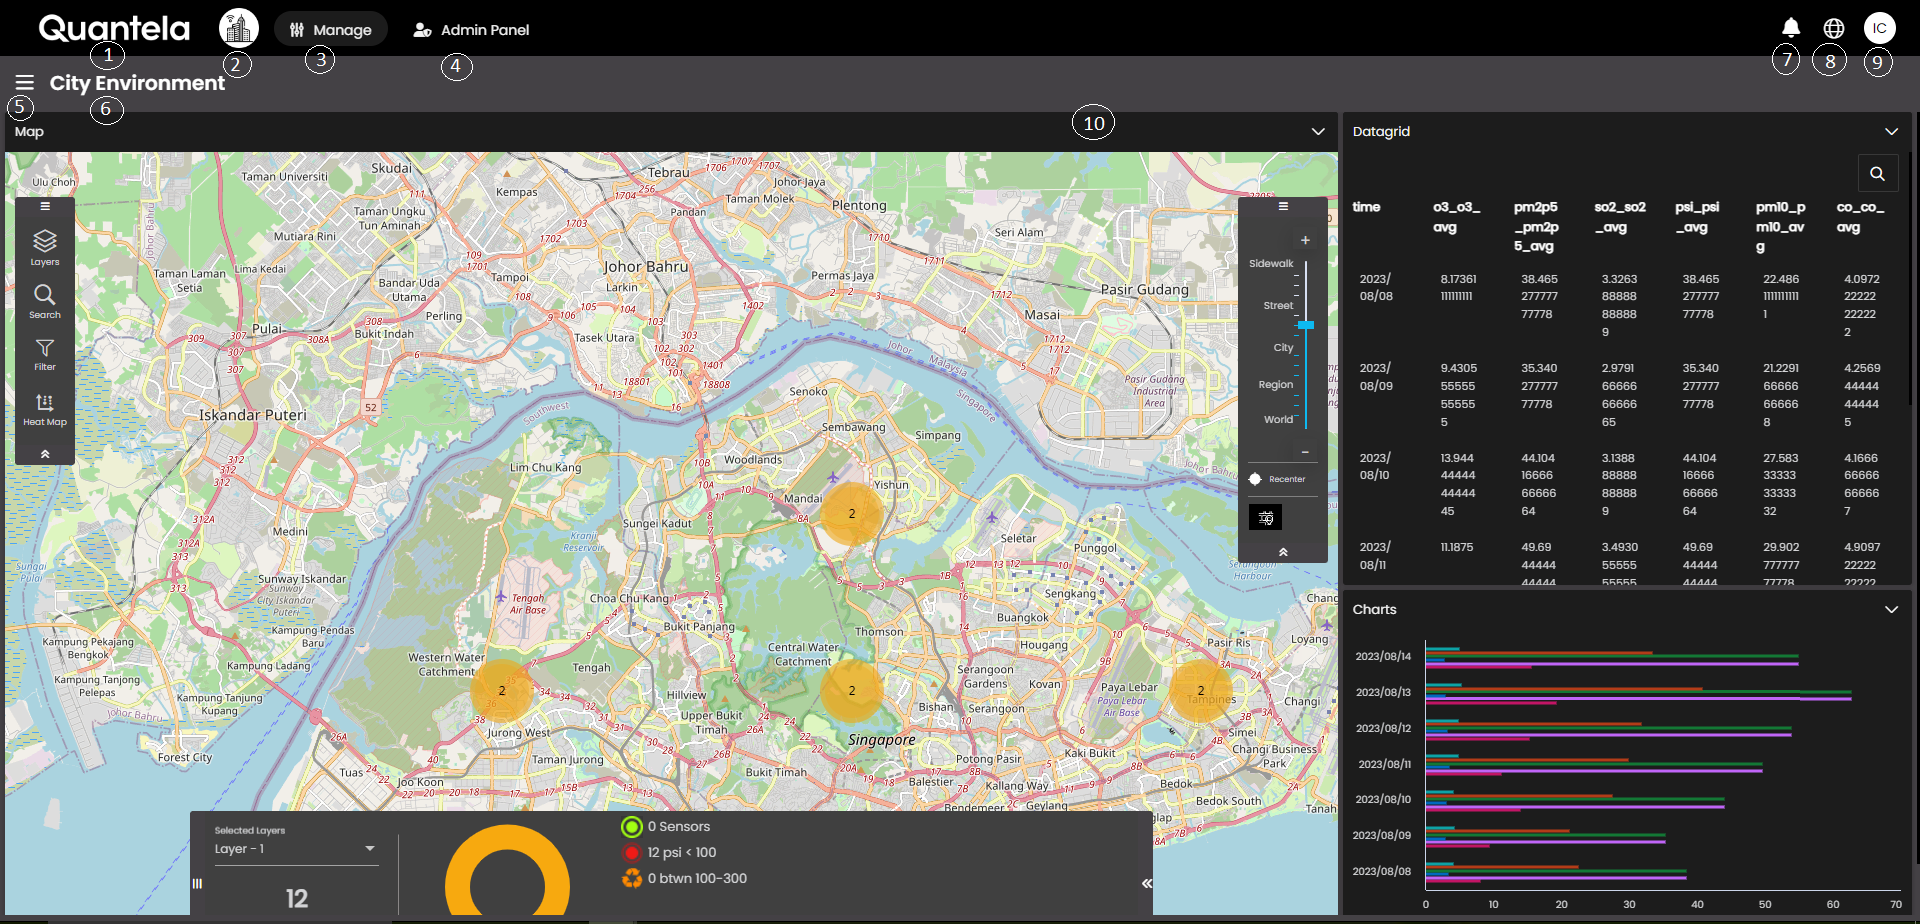
Primary Logo: This is where the primary logo is displayed. For more information, see Configure branding settings.
Customer Logo: This is where the customer logo is displayed. For more information, see Configure branding settings.
Manage: It allows the users to configure and manage all the operations like Events, Data Pipeline, Automation, Citizen, Field Operation, etc. For more information, see Manage.
Admin Panel: It allows the users to configure and manage all the operations like User Administration, Appearance, Maps, Logs, etc. For more information, see Admin Panel.
Dashboards menu icon: This is where the name of the current dashboard is shown. Also, this is where you select a dashboard to view. A dashboard displays information from your sensors, using one or more widgets. For more information, see Select a dashboard.
Dashboard Title: This is where the title of the current dashboard is shown.
Notifications icon: This is where you view system messages that are generated when specific incidents occur, such as a sensor threshold value being reached, a car park full event, or traffic congestion.
Language icon: This is where you select a language in which the platform information needs to be displayed. For more information, see Translate dashboard based on language.
User Profile icon: This is where you sign out, or specify settings associated with your user profile, for example your password and the user interface locale. For more information, see the relevant sections under User Profile.
Widget: For more information, see Widgets.