Configure map widget settings
You can configure the layers that are included on the map, for example the dataset to be used for each one, the search settings within each layer, and selection of markers (which represent items from the dataset on the map).
If the widget configuration dialog box is not already open, do as follows:
If the widget is on a Grid layout dashboard, click the Menu icon
 in the top right-hand corner of the widget and select Settings.
If the widget is on a Fluid layout dashboard, on the floating toolbar for the widget, click the Settings icon:
.
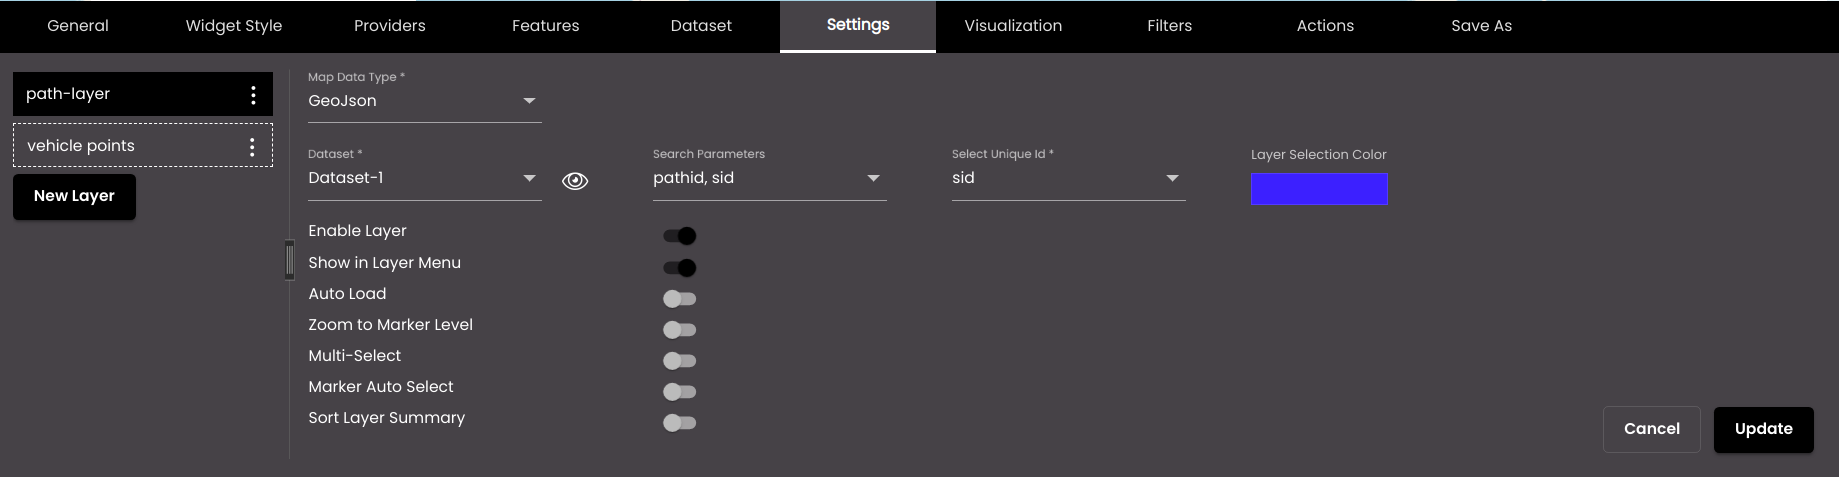
In the widget configuration dialog box, click the Settings tab.
When you configure layers for the first time, click Add Layer.
A new layer is created for you to configure.
On the left-hand side of the tab, you can rename the layer. The name is displayed in the layer tool on the Designer floating panel. Click the Actions icon
 and then click the Edit icon. Enter the new name and click the Update icon.
You can also translate this text by clicking on the Translate icon
 and entering the translation of the desired language selected. Auto-suggestions are also available where the reused contents are auto-suggested.
Change the settings as required:
Setting
Description
Dataset
The dataset to use for this layer.
Map Data Type
Although all datasets for map widgets supply data in GeoJSON format, if the dataset includes a shape file, WMS tile, ESRI feature layer or ESRI dynamic layer etc, as set up in Map Layers, select that here. The layer will then support only the default color and icon.
Search Parameters
The fields in the dataset on which you want to search. For example, if you select the status field, then when you click Search in the Designer floating panel, the text that you enter there is searched for in the status field, and matching markers are shown on the map. If you select more than one field, the text that you enter is searched for in each field.
Select Unique Id
It is used internally for uniquely identifying a marker in order to update and take the respective actions on it.
Note
If the dataset is edited or updated later such that the property selected in Select Unique Id is removed, a message is briefly displayed once the dataset is refreshed and Update is clicked in the Dataset tab, intimating that the Unique Id is missing.
Layer Selection Color
The color that is used to highlight markers that you select on the map, by clicking on them. In the example below, red is used:

Also, based on the Palette in the Widget Style tab, a set of Preset colors are available to directly choose from, which if selected, change based on the theme.
Layer Title
Select the map layer here that was setup in the Map Layers tab of the Maps tab in Settings.
Select Layer Ids
The layer ids for the child layers that come under the parent map layer selected in Layer Title.
Enable Layer
The layer information will not be displayed in the Summary Panel and the marker information will not be displayed on hovering the mouse over the marker.
Show in Layer
Displays the name of the layer in the layer tool on the Designer floating panel. From there, you can select whether the layer is displayed on the map. For more information, see Select layers to display in map widget.
Auto Load
Displays the layer on the map when the map is refreshed.
Zoom to Marker Level
Zoom in to display the first marker in the dataset, which is also shown as selected, if the layer is selected in the layer tool on the Designer floating panel and the map is refreshed.
Multi-Select
Enables you to select more than one marker at a time, by clicking on them.
Marker Auto Select
Zoom in to display all the markers in the dataset, with the first marker in the dataset shown as selected, if the layer is selected in the layer tool on the Designer floating panel and the map is refreshed.
Sort Layer Summary
By default, the summary icons would be displayed in the order of creation. If we enable this option, the icons summary would be displayed based on the count.
Note
If there are multiple layers, then the parent layer has only the settings Enable Layer and Auto Load and no other configurations. Instead, all the configurations are present only for the child layers.
For the Map Data Type ESRI Dynamic Layer, the settings Layer Title, Select Layer Ids, Enable Layer, Show in Layer Menu and Auto Load are only displayed.
Click Update.
You can add further layers if you want to. To do this, click New Layer.
You can also nest layers inside one another. In the following example, five nested layers have been set up, each showing data for a particular component of the atmosphere. In the layer tool, two of these are selected for display.
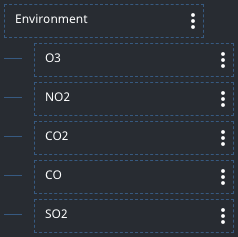
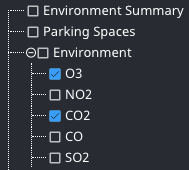
Selecting Environment would select all of the nested layers for display.
To add a nested layer, click the Actions icon
on the layer in which you want to add the nested layer. Click the Add New Layer icon. A new nested layer is created for you to configure.