Create a dataset
In the top left-hand corner of the main dashboard screen, click the Manage icon:
 .
.On the Manage panel, click Data Pipeline
 .
.On the right-hand side of the Datasets screen, click the Dataset icon:
 .
.In the bar near the top of the Datasets screen, if you want to select an icon that can be used to indicate the meaning of the dataset, click the Icons icon:
 .
.Click newDataset and enter a descriptive name for the dataset. Click the ‘tick’ icon to confirm this:
Click the drop-down list to select the format for data to be stored in the dataset. The options are as follows:
JSON JavaScript Object Notation (JSON) is a standard format for representing semi-structured data in a hierarchical arrangement of attribute–value pairs and arrays.
GeoJSON This is an open standard format to represent geographical locations and some corresponding properties. Each location can be represented as a point with specific latitude and longitude coordinates, a line (for example, a road), a polygon (for example, a district), or a collection of these types. In the Quantela platform, the GeoJSON format is most often used in the map widget.
CSV This is a traditional, tabular data format consisting of rows of data with one or more named columns. The CSV data format is generally used by the chart and datagrid widgets in the Quantela platform dashboards.
Text This is a representation of unstructured textual data.
HTML Datasets of this type are used to store HTML-formatted data.
XML Datasets of this type are used to store XML-formatted data.
Note
For CSV or JSON output format of the dataset, data will convert to CSV or JSON respectively. There is no need of using CSV to JSON or JSON to CSV functions in the dataset for conversion.
Click the Caching icon:
 . Specify whether or not data in this dataset should be cached and, if so, for how long:
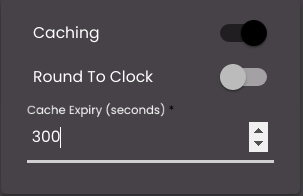
Cached data is retained in memory for a period of time so that it does not have to be retrieved from the data source again, allowing widgets to display information more quickly.
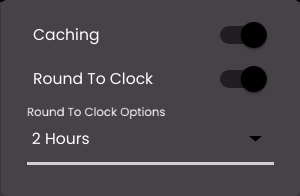
Also, as a part of the caching component, Round To Clock if enabled, reduces the ingestion time and the data mismatch between different dashboards and databases.
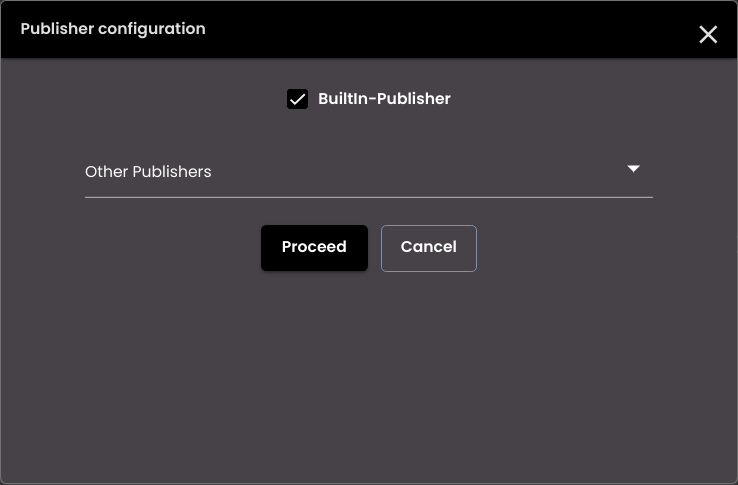
Select the Publisher checkbox to select a BuiltIn-Publisher and/or any of the MQTT and Socket publishers from the list in order to publish the data. The BuiltIn-Publisher is the Abstraction Socket Server which is to be used to connect to when you want to listen for any data updates whereas the other publishers are external vendors Socket/MQTT connectors which are to be used when you want to push data to those external servers.
Note
To publish data in order to view the real-time updates of markers in a map widget or values in a chart widget you need to select the BuiltIn-Publisher. You can then configure the map widget or chart widget to receive the real-time updates from this dataset. For information on map widgets see, Real-time update in a map widget and for chart widgets see, Real-time update in a chart widget.
Click the more icon:
 .
.Configure the following general settings as required in the more panel:
Setting
Description
Description
An optional description of the dataset.
Version
Optional version information.
Tags
One or more optional descriptive tags for the Dataset.
Tag
Description
reports
Used to generate reports for this dataset. For more information, see Create a report.
updates
Used to view the route of the map markers using this dataset in the real-time update in a map widget. For more information, see Real-time update in a map widget.
linestring
Used to view the pre-defined route of the map markers using this dataset in the real-time update in a map widget. For more information, see Real-time update in a map widget.
canvas
Used to load large number of map markers using this dataset in the map widget. For more information, see Load large number of markers in a map widget.
historicstart
Used to view the live data of the map markers using this dataset in the historical route marker movement in a map widget. For more information, see Historical route marker movement in a map widget.
historicroute
Used to view the historical route of the map markers using this dataset in the historical route marker movement in a map widget. For more information, see Historical route marker movement in a map widget.
webhooks
Used to be able to to push data seamlessly without access tokens using this dataset. For more information, see API Keys.
dashboard filters
Used to configure the custom dynamic filters using this dataset to filter the data in the widgets. For more information, see Configure dashboard filters.
custom data API
Used to be able to push data seamlessly using this dataset. For more information, see API Keys.
Domain Name
Name of the domain to which the dataset is to be associated with.
Configuration Logs
If enabled, the logs are generated when saving and previewing the data.
Press the Proceed button to save this configuration information.
Configure the data flow by dragging providers, functions, and datasets from the lists on the left of the Datasets screen to the data flow canvas, configuring each of these nodes, and connecting the outputs from one node to inputs on other nodes as required.
The example screenshot below shows that weather data is received from an HTTP (REST) connector and environmental data is received from another, previously configured dataset. These both have input parameters that would be supplied by the dashboard widget or by a broadcaster. The JSON data from these two data sources is combined in a Join function node, and the merged JSON output is passed to two other function nodes: one that filters the data and one that applies some custom transform logic. The outputs from these two nodes are then joined again to produce the dataset.
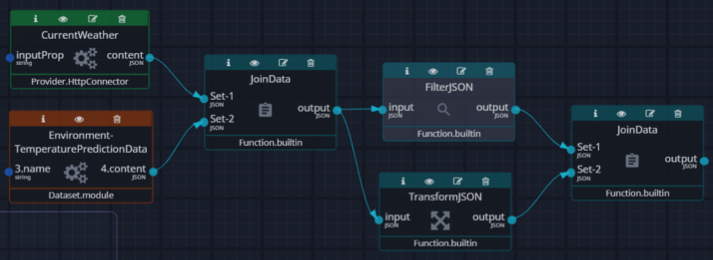
Most data flows are much simpler than this, and they may contain nothing more than a single provider node.
The data sources for the dataset can consist of one or more providers and/or other datasets. Once you have dragged a provider to the canvas, the Quantela platform prompts you to select a corresponding connector if this is required. Only those connectors whose type matches that of the selected provider (File, HTTP, and so on) are displayed. Select the connector from the list and click Proceed to place the node on the canvas. All of the providers other than the Quantela Data require a corresponding connector.
Click the Config icon
 on the provider node to view or edit the configuration details or properties for the corresponding connector and connector template. The specific configuration options in the Configuration tab depend on the connector type. For an explanation of the options, see Connectors.
Click on the Properties tab to review and update the following properties:
Setting
Description
Node name
A descriptive name for the data provider.
Description (optional)
A description of the provider.
Tags (optional)
One or more descriptive tags for the provider. Hit Enter on the keyboard after typing the tag descriptor to add it to the list.
Version (optional)
Version information.
Icon (optional)
An icon to be associated with the provider.
Click Proceed.
You can click on the Full Screen icon
 to maximize the side panel in the node configuration so that there is more real-estate to work on scripts. Also, you can click on the Help icon
  to assist in using the different connector types, functions and providers.
Click the Preview icon
 on the provider node to preview the data returned by this provider and the abstraction logs node level logs that have been added from the backend. If the InfoLogs checkbox is checked then the success logs will be displayed along with the error logs. Also, you can click on the Full Screen icon to maximize the panel in the preview so that there is more real-estate to make changes.
Click the Copy icon
 on the provider node to easily copy and paste a particular node or a set of connected nodes and it can be reused in the same or different dataset.
In addition to using providers (connectors) as data sources, you can select another dataset to be a data source for the new dataset. Simply drag a dataset from the list of previously configured datasets on the left of the Datasets screen to the canvas. The output from this dataset will be available as an input to the new dataset.
Drag function nodes from the list on the left-hand side to the canvas. The different types of function and their configuration are described in Functions.
Connect each function node to data provider nodes and/or other function nodes by clicking on an output from one node and dragging it to an input on another node. Each input and output is shown with a corresponding type (JSON, CSV, and so on). It is only possible to connect an output from one node to an input on another node if they have the same type.
When you have configured the dataset, in the bottom right-hand corner of the canvas, click Save and Generate Schema to save it with schema or Save Dataset to save it without schema.
Note
The dataset that doesn't have schema generated for it will not be available in the Dataset screen of the widgets.