View SOP Audit
Each time that a SOP template is executed or a SOP is triggered by an Automation Rule it generates a new SOP Instance which is displayed in the SOP Audit. The SOP instances displayed are only from the domains and regions that the logged in user’s role has access to based on Role-based Access Control (RBAC). For more information on access for roles, see Roles.
To view details of current SOP Instances, click the Manage icon:  on the dashboard, then click on Events and then SOP Audit.
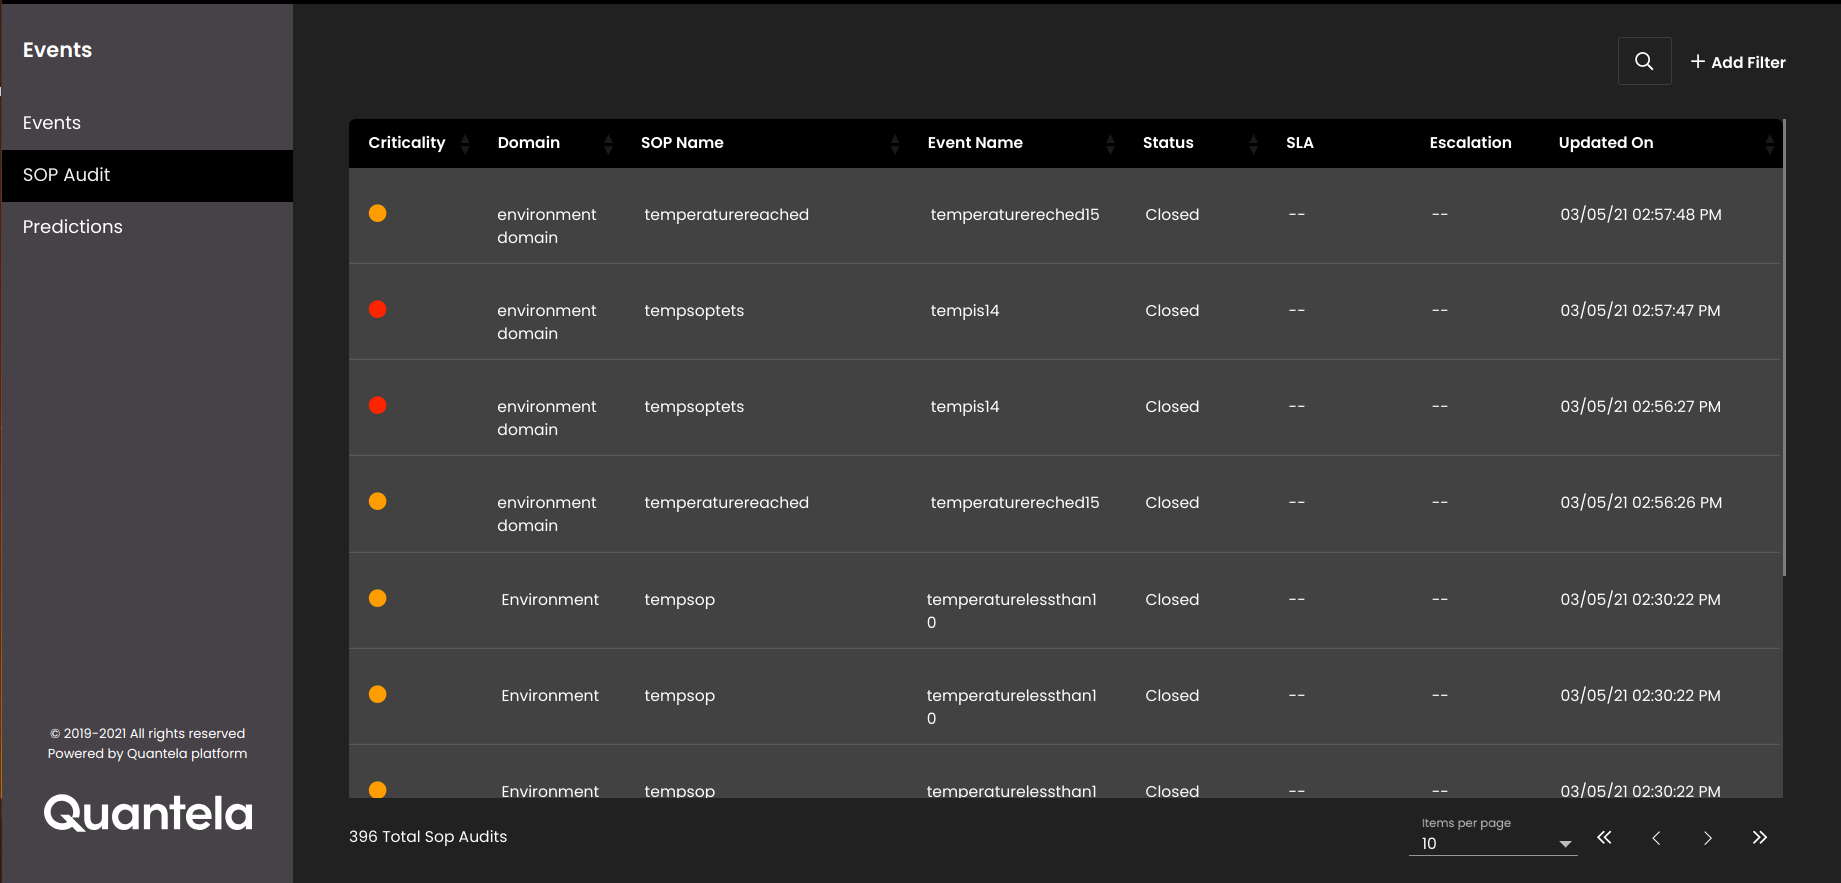
Each SOP Instance has a Status which reflects the status of its tasks. The status cannot be updated here - to progress a SOP you must complete each of its tasks.
The Criticality for each SOP Instance has coloured icons to differentiate high, medium and low criticality SOP instances.
To filter the displayed SOP instances, click the Add Filter icon:  . In the panel that is displayed, select a Domain, an Event Source, an Event Type, Criticality level, a Status, and/or select a Date Range.
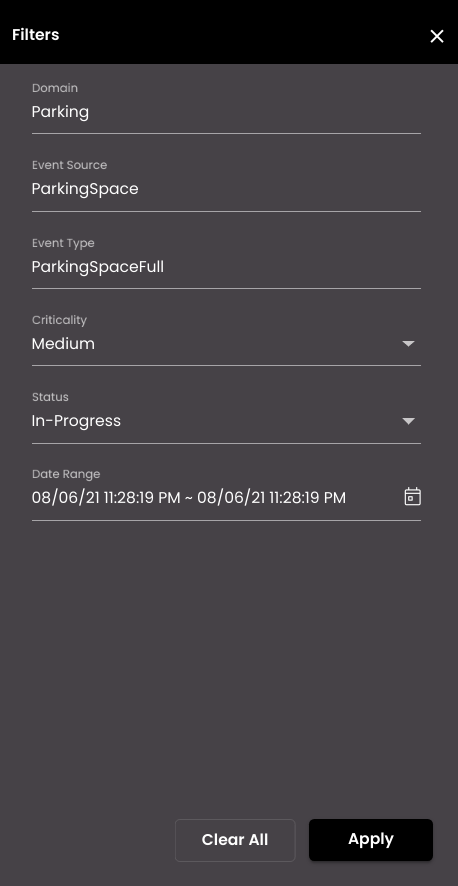
Press the Apply button to apply this filter. To subsequently edit the filter, click the Modify Filter icon:  . Hover your mouse over the
  next to Modify Filter, to view the filter values that you applied. To reset the filter, click on Clear All in the filters panel.
To search for any SOP instance within the currently displayed SOP instances, enter your text in the Search SOP Audit panel which is displayed on clicking the  icon.
icon.
Click on an individual SOP Instance to see full details of the SOP in the dialog on the right. The map marker colour is shown based on the criticality of the SOP instance.
To see more SOP Instances in the list, either select another value for Items per page, or select another page.