Real-time update in a chart widget
The chart widget can display the near real-time activity of the chart values by using the streams functionality of datasets. This has been achieved by using the progressive rendering as similarly done in the map widget.
Firstly, to allow the real-time update in the chart widget, the Enable Realtime Updates option should be enabled in the Data Refresh Settings of the Dataset tab.
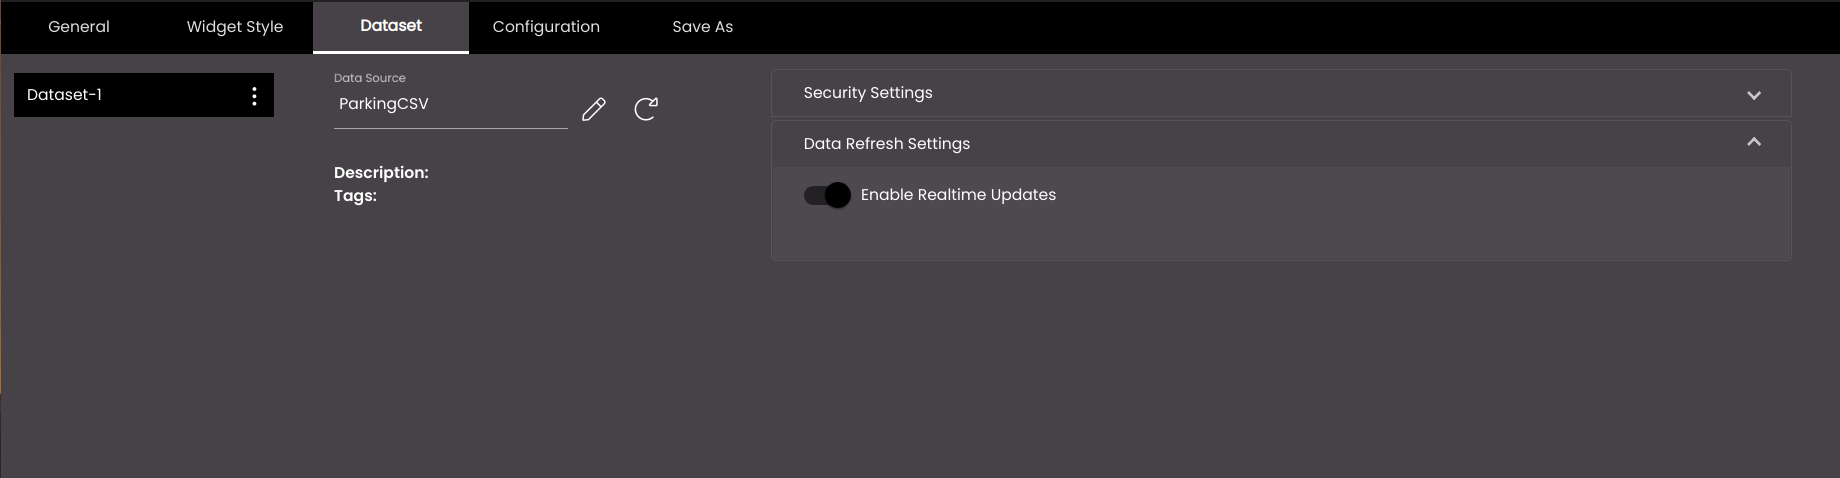
This Enable Realtime Updates option will be displayed only if the selected dataset has the BuiltIn-Publisher selected in it. For information see, Create a dataset.
Configure the rest of the settings in the chart widget as described earlier.
Once all the configuration settings are done you can see the real-time updates in the chart widget.
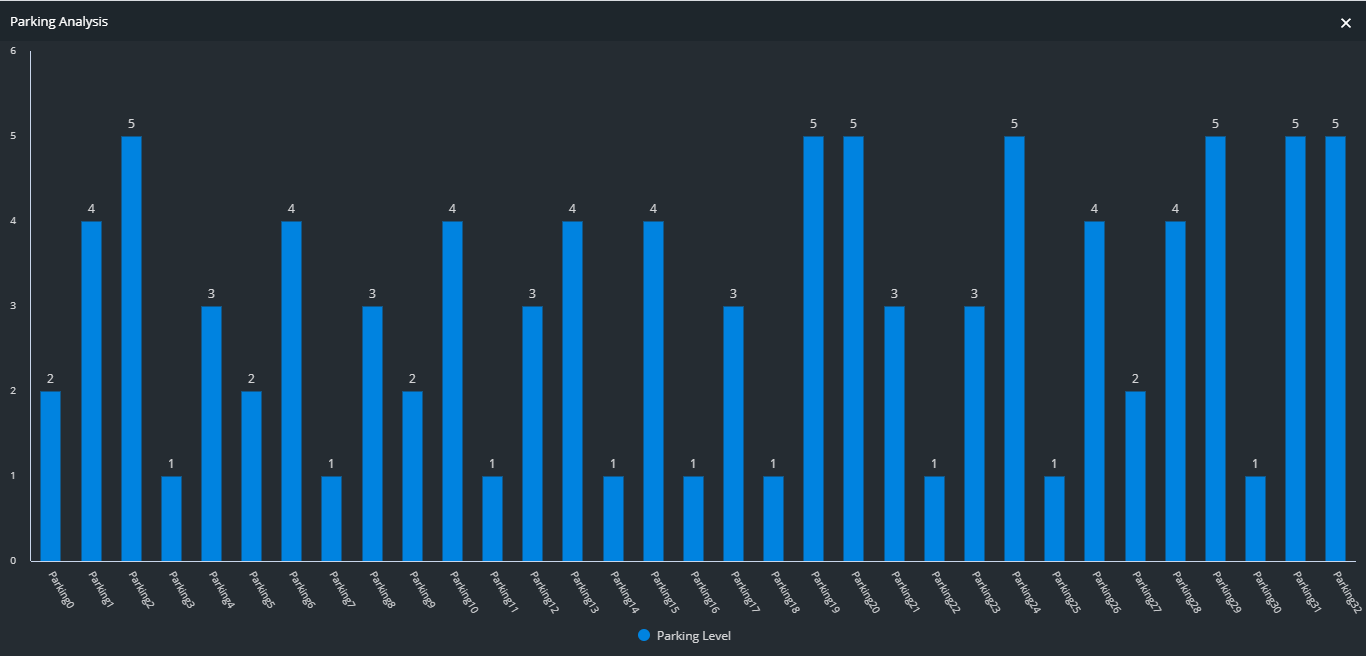
In the following example, you can see that 33 parking levels are present on the x-axis, each containing a certain number of cars on the y-axis as seen in the figure below:
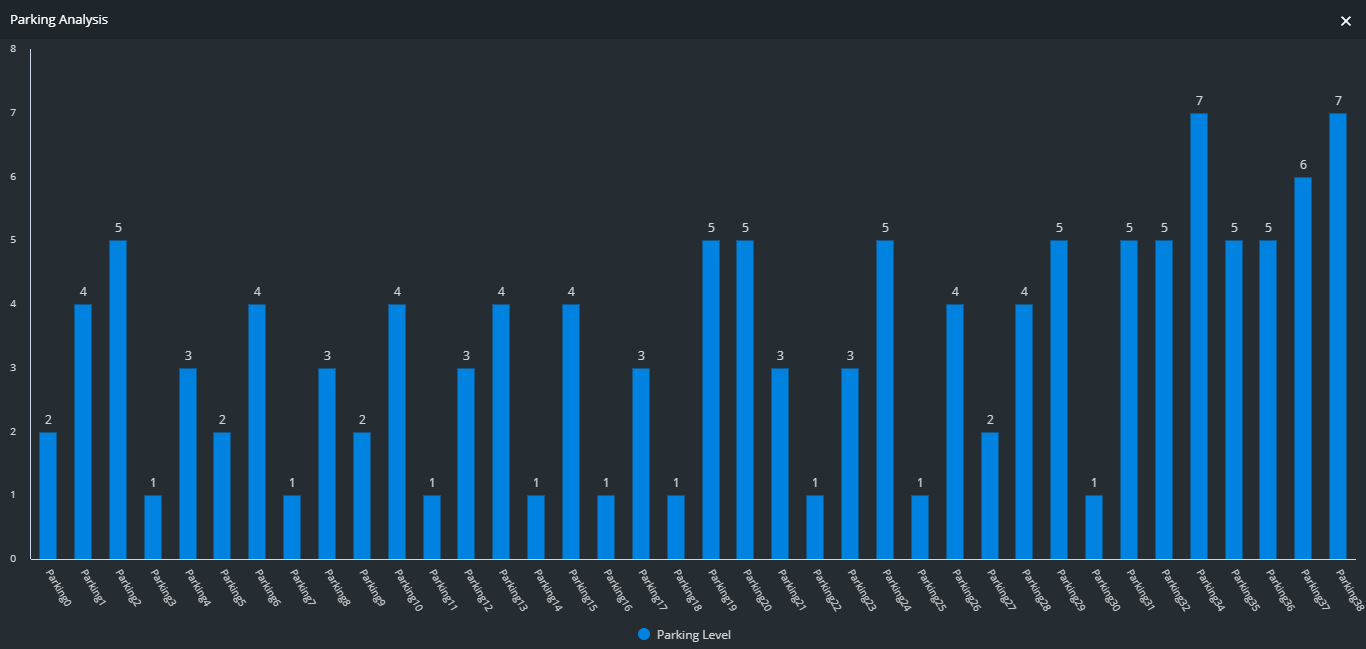
Later there was an update in the number of parking levels and the changes were automatically reflected on the chart. The chart now displays 38 parking levels because 5 more parking levels were added as seen in the figure below: