KPI widgets
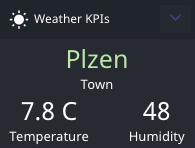
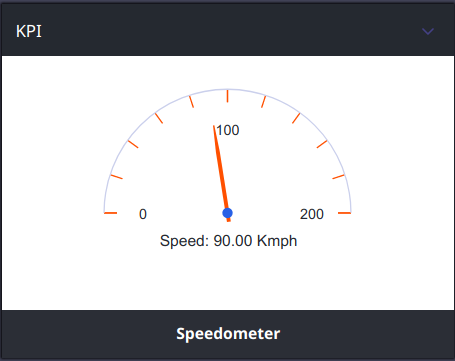
KPI (key performance indicator) widgets are used to display significant values in a simple format that enables them to stand out, for example:

The widgets can also indicate how the KPI compares with another value in the dataset. This may be useful, for example, for showing the KPI relative to a significant threshold value.
Additionally, there are KPI templates containing image, progress and label-value combinations and also a custom template which can be created by dragging and dropping the KPI components (Numeric KPI, Bullet Chart, Gauge Chart, Chart, Text, Image and Progress) in the panel.

KPI widgets are populated with data from CSV datasets, in which data is in tabular form. The information can be updated in response to events, either those at the dashboard level or those triggered by other widgets.
There are three main types of dataset that you can use with KPI widgets:
A dataset that returns a table of values that is filtered on one of the fields
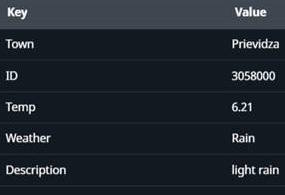
The filtering is achieved by specifying request parameters on the Dataset tab of the widget configuration, so that only one row is returned at a time. For example, if you specify ID to be 3058000, the following row would be returned from a weather data source:

If the dataset is configured to be refreshed by an event that passes a different value for the ID parameter, a different row would be returned in response to that event.
The widget can then display one or more values from the current row.
A dataset that returns an unfiltered table of values
This is achieved by not specifying any request parameters, so that all the rows in the table are returned. For example:

The widget can then display a value that is based on a function of all the values in a particular column. For example, it can display the average of the temperature values.
A dataset that returns a sequence of key–value pairs
The data source is filtered by specifying request parameters on the Dataset tab of the widget configuration, so that only one row is returned at a time. Then, for each row, each field and value is represented by a key–value pair. For example:

If the dataset is configured to be refreshed by an event that passes a different value for one of the request parameters, a different row would be returned in response to that event.
The widget can then display one or more values from the current row.
Note
Key–value datasets can't be used with bullet graph KPI widgets.
Having added a KPI widget to a dashboard, you need to perform the configuration of general settings and the dataset, and also some further configuration that is specific to KPI widgets.