Timeline widgets
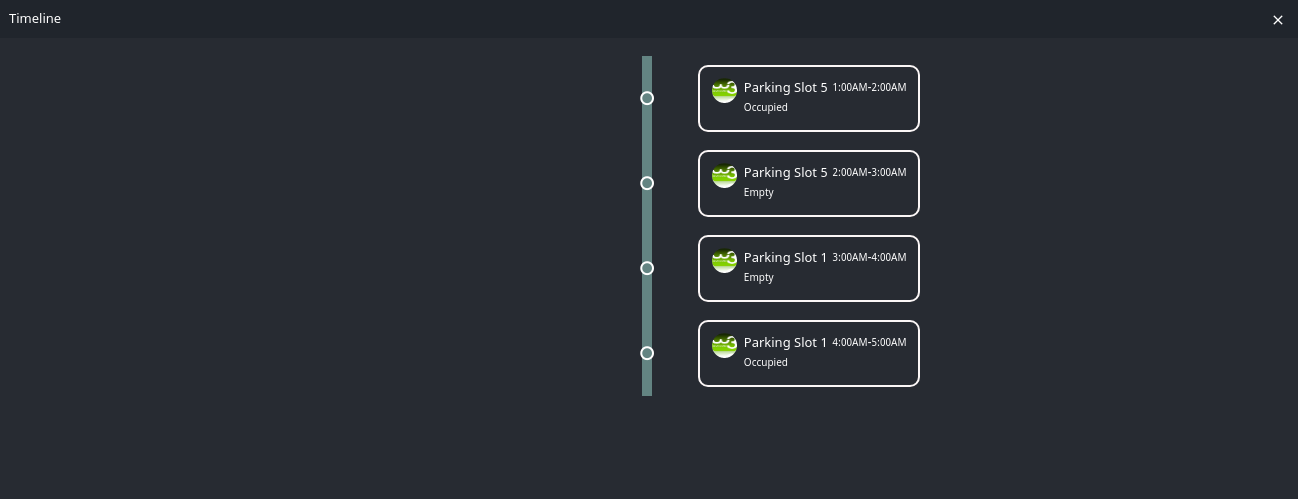
A Timeline widget visualizes events over a time span. The widget displays every data point as a separate event along a vertical line.
For each point defined in the timeline series, a flag is placed with a descriptive text. By default, the tooltip shows text specified for the label property of the data series point.
Timeline widgets are populated with data from CSV datasets, in which data is in tabular form. The information can be updated in response to events, either those at the dashboard level or those triggered by other widgets.
Having added a timeline widget to a dashboard, you need to perform the configuration of general settings and the dataset that is used to populate the widget with data, and also some further configuration that is specific to timeline widgets.