Configure timeline widget data series
A timeline widget contains one or more data series. A data series is the column of data used to display the data on the card. For example, a series may be a parking spot occupancy at a particular time.
If the widget configuration dialog box is not already open, do as follows:
If the widget is on a Grid layout dashboard, click the Menu icon
 in the top right-hand corner of the widget and select Settings.
If the widget is on a Fluid layout dashboard, on the floating toolbar for the widget, click the Settings icon:
.
Click the Configuration tab.
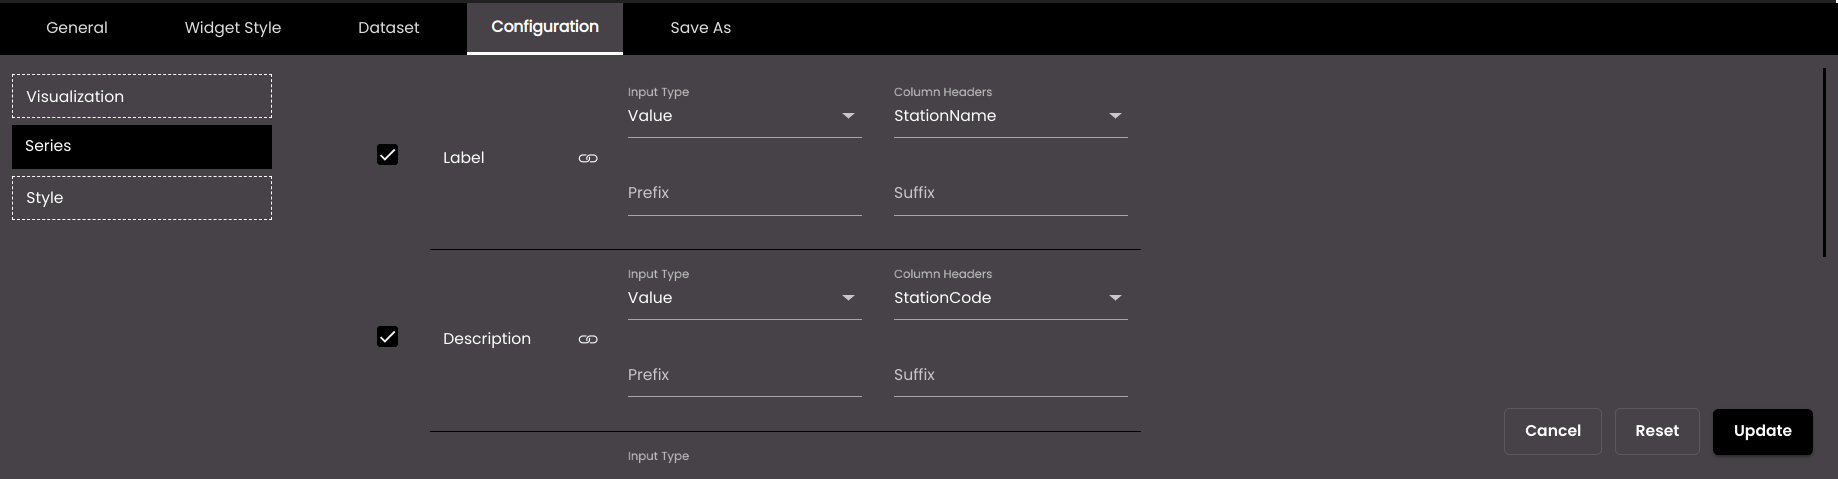
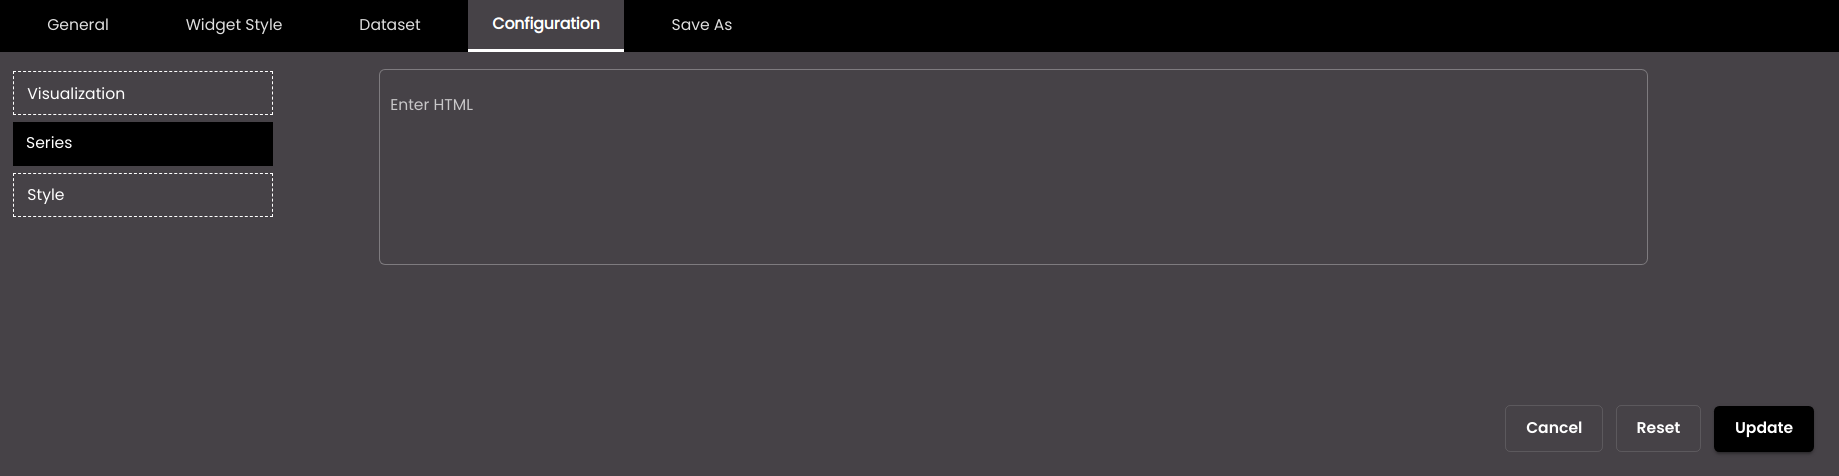
On the left-hand side, click Series.
If you had selected the Predefined visualization in the Visualization tab then either manually enter the values or select the columns data that need to be used to show the Label, Description, Start Time, End Time and Thumbnail on the card. You can also enter a Prefix and Suffix in plain text or HTML code for each of the values on the card.
Otherwise, if you had selected the Custom visualization in the Visualization tab then enter the HTML code that needs to be displayed on the card.
Click Update.