Zoom in on a chart widget
If a chart widget has been configured to allow zooming, you can use your mouse to zoom in on part of the chart.
To check which axes allow zooming, see Configure chart widget style.
To zoom in on data points along an axis, click and drag the mouse pointer in a line roughly parallel to the axis, and release the mouse button when you have selected the area that you want to enlarge:
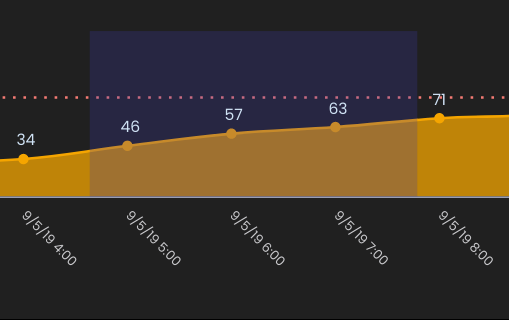
The chart is enlarged along that axis.
To zoom in on data points along both axes, click and drag the mouse pointer diagonally.
To revert to the original size of the chart, in the top right-hand corner of the chart, click Reset zoom.