Events
An Event in the Quantela platform is a manual or an external or system-generated activity which is of interest to users of the platform. Events are created manually or generated by Automation Rules in response to specific data triggers. The events displayed are only from the domains that the logged in user’s role has access to based on Role-based Access Control (RBAC). For more information on access for roles, see Roles.
To view details of current events, do one of the following:
Either click on the 'bell' Notifications icon at the top of the screen:
 . In the pop-up notifications window select Events, then View All.
Or click the Manage icon:
 on the dashboard, then click on Events.
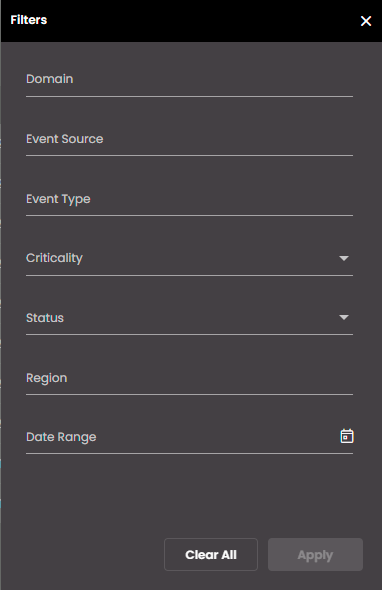
To filter the displayed events, click the Add Filter icon:  . In the panel that is displayed, select a Domain, an Event Source, an Event Type, Criticality level, a Status, and/or Region from the list, and/or select a Date Range.
Press the Apply button to apply this filter. To subsequently edit the filter, click the Modify Filter icon:  . Hover your mouse over the
  next to Modify Filter, to view the filter values that you applied. To reset the filter, click on Clear All in the filters panel.
To search for any event within the currently displayed events, enter your text like the criticality, event name, description or status in the Search Events panel which is displayed on clicking the  icon.
icon.
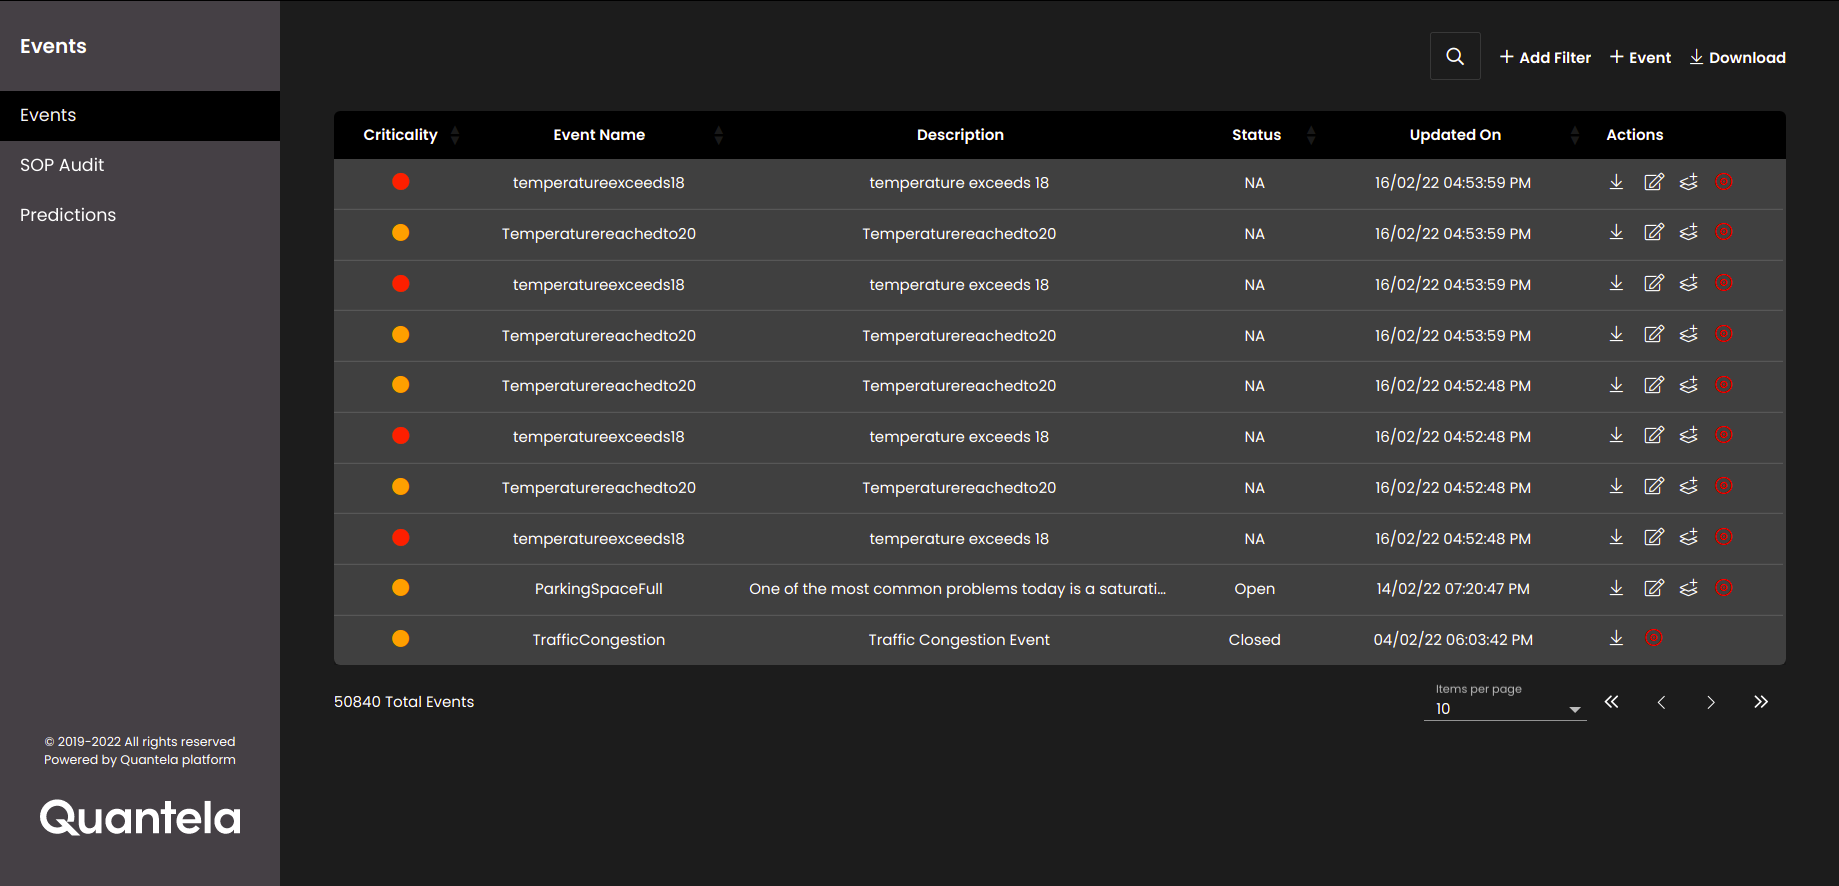
The Criticality for each event has coloured icons to differentiate high, medium and low criticality events.
To see more events in the list, either select another value for Items per page, or select another page.
Click on an individual event to see full details of the event along with its associated SOP instance, task, comments and child events, in the dialog on the right.
In the Event Details tab, you can see the details of the event and the map marker colour is shown based on the criticality of the event.
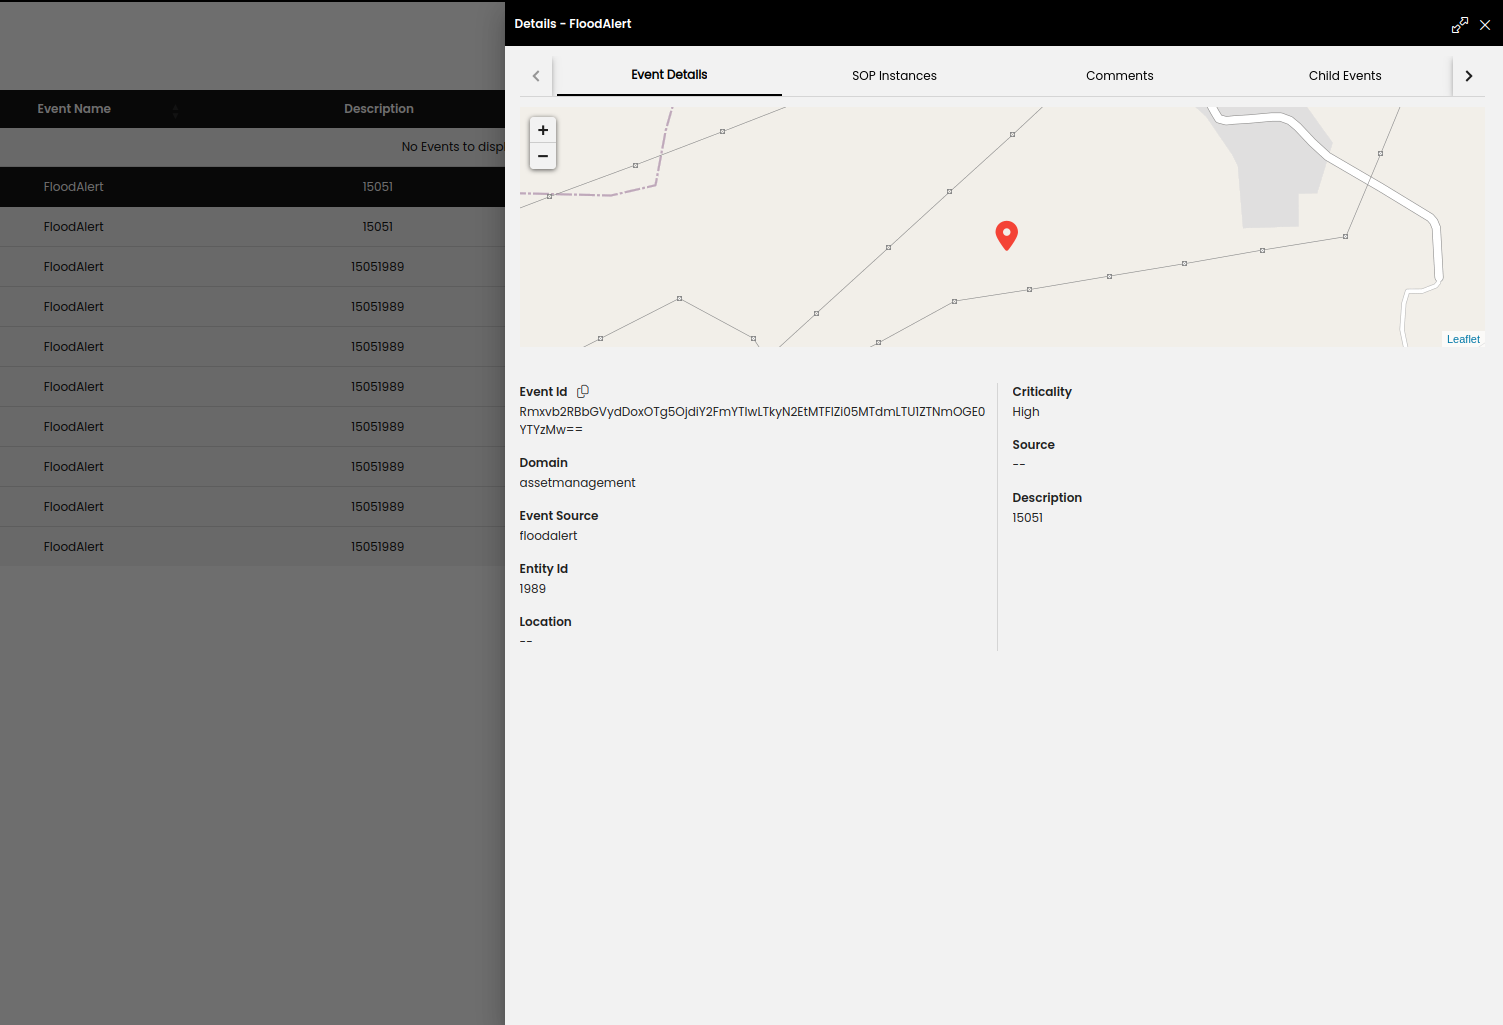
Also, you can configure the settings of viewing the cameras near an event location in Video. Once the configuration is done you can then see a toggle button Display cameras on map in the event details, which if enabled, displays all the cameras near the event location. On hovering over these cameras on the map, you can see the live video at that location.
You will also be able to see the options of Screenshot, Record and Full screen on the camera feed pop-up. On clicking on the Screenshot icon  , a snapshot of the current feed is captured and will be saved in your downloads folder. On clicking on the icon
  , the recording of the feed begins and in turn on clicking on the icon
  , the recording of the feed stops and will be saved in your downloads folder.
If QVMS Bridge is configured, if you click on the or icons, a confirmation dialog is displayed for you to choose if you only want to Download the snapshot or recording or Create Event as well with the snapshot or recording.
If Create Event has been selected, the snapshot or recording of the current feed is downloaded as well as the manual New Event panel is displayed with the snapshot or recording attached and with the following properties pre-populated:
Setting | Description |
|---|---|
Domain | The Domain selected in the previous event. |
Event Source | The Event Source selected in the previous event. |
Criticality | The importance of the event is set as High. |
latitude | The latitude of the camera. |
longitude | The longitude of the camera. |
Select the Event Type and click Create to create the event and it is created and can be seen in the list of events.
On clicking on the Full screen icon  , you can view the feed in a dialog and it allows to control the focus of the displayed feed.
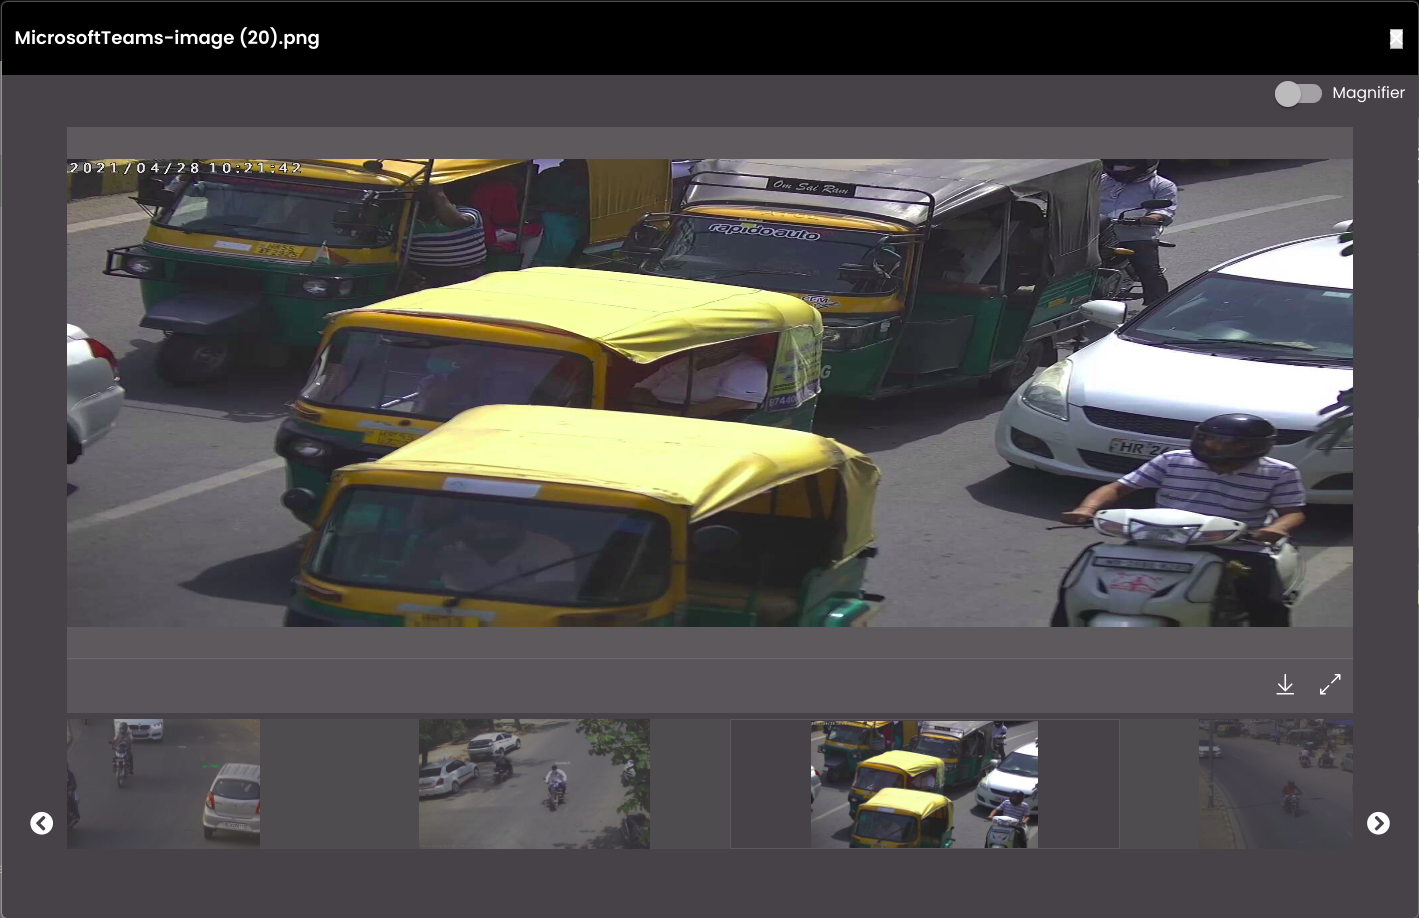
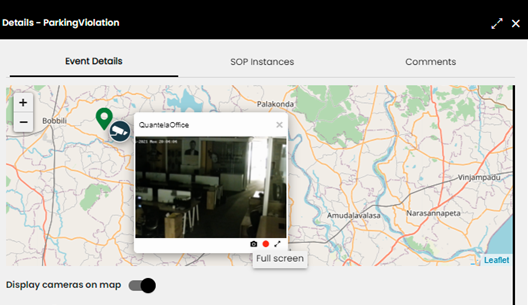
A media viewer is also present to enhance the viewing of the media by being able to download and maximize them and also you can carousel among the images, videos and audio files that were earlier uploaded for that event.
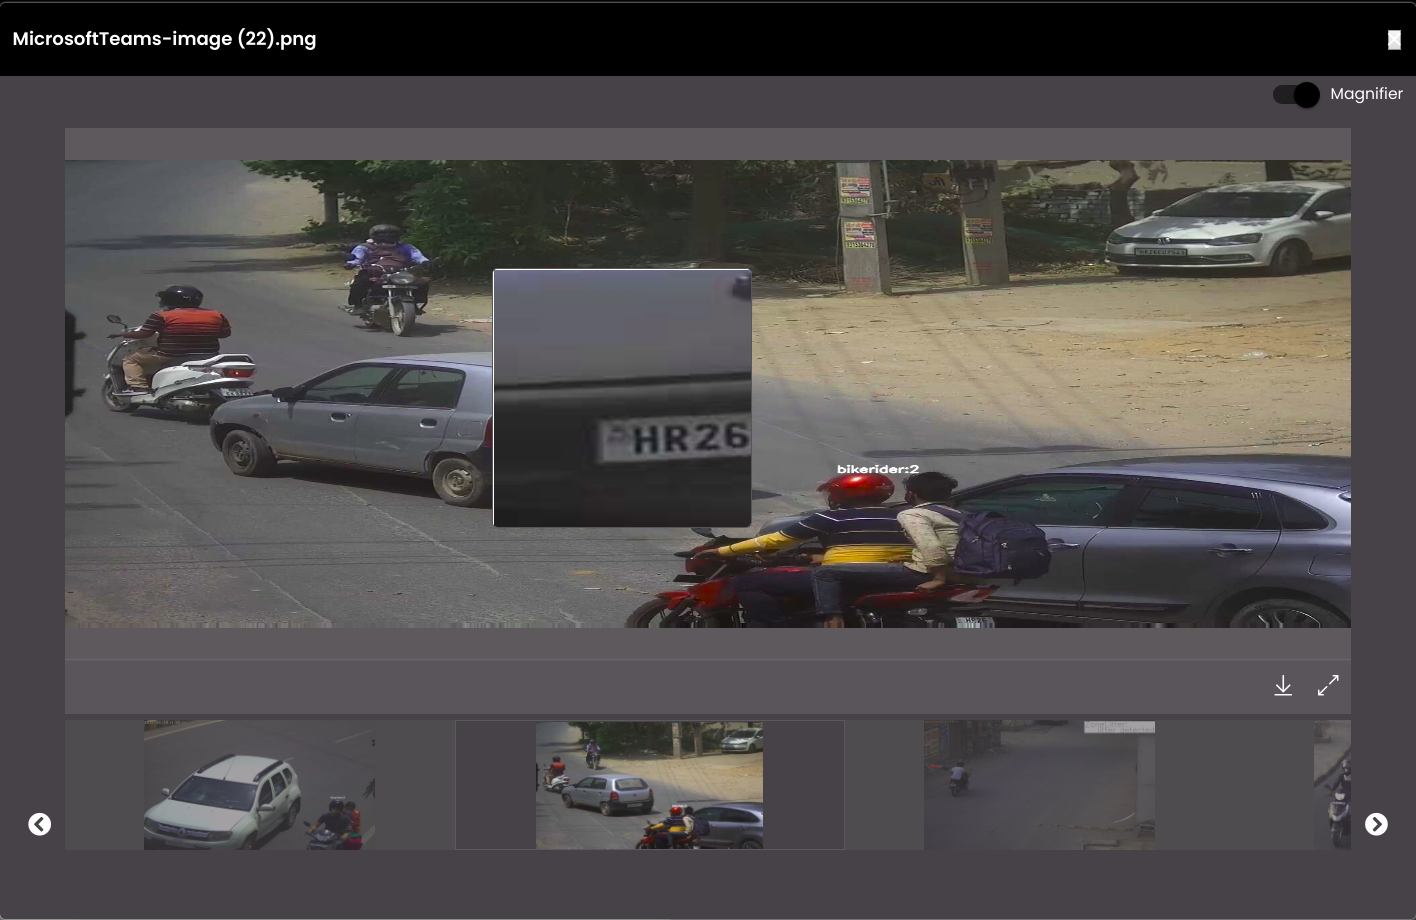
There is also a Magnifier toggle button in the media viewer, if enabled, displays a magnifier over the image which helps to magnify a particular portion of the image to be able to see it clearly and get into its details.
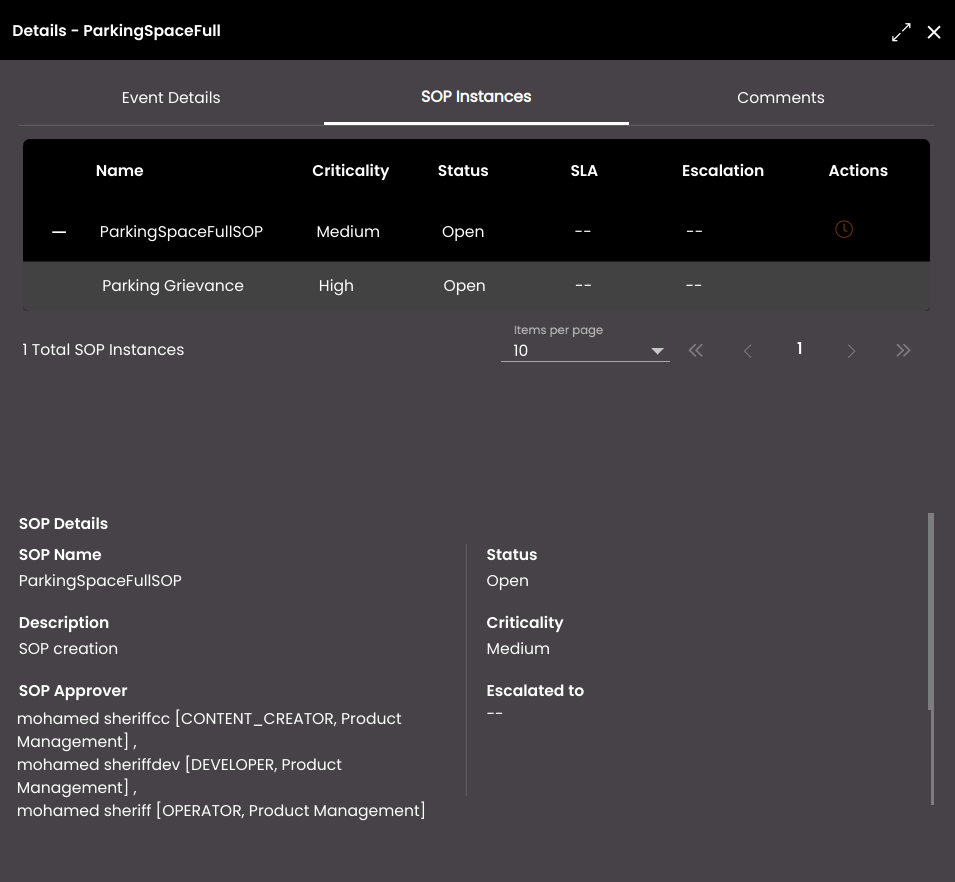
In the SOP Instances tab, you can view the details of the associated SOP Instances and tasks for the event. Each time that a SOP is triggered by an Automation Rule it generates a new SOP Instance. Each SOP Instance has a Status which reflects the status of its tasks. Click on an individual SOP Instance to see full details of the SOP. The map marker colour is shown based on the criticality of the SOP instance. You can edit the Criticality and Status of the SOP instance by clicking on the Edit icon  under Actions. Also, depending on the status, you can enter a comment in Add Comment. If it is assigned to you, you can Approve or Reject the SOP instance that is in Approval Pending state by selecting any of them on clicking the Approval Pending icon. Once it is approved you can see the Approved icon and the User Task will be assigned otherwise if it is rejected you can the Rejected icon and the User Task will be closed. To see more SOP Instances in the list, either select another value for Items per page, or select another page.
You can view the tasks of the event by clicking on the  icon on the left of the SOP instance Name. A Task is a step in an SOP workflow which requires manual intervention. A task is initiated by a SOP when a User Task is used to notify one or more operators of an event or when the SLA of a SOP has crossed. To view details of current tasks, do one of the following:
Either click on the 'bell' Notifications icon at the top of the screen:
. In the pop-up notifications window select Tasks, then View All, then click on an event and click on the icon in the SOP Instances tab. If it is an SOP escalation notification, then in the pop-up notifications window select Tasks, then click on an escalation which will then navigate to the associated SOP instance in the SOP Instances tab.Or select Manage after clicking on the Menu icon on the dashboard, then click on Events. Click on an event and click on the
icon in the SOP Instances tab.
Each task has a Status which indicates the current stage of the task. Tasks have to follow a specific state progression, so only valid states will be presented.
Assigned
On hold
In progress
Resolved
Closed
Reopen
Failed
Click on an individual task to see full details of the task. You can edit the Criticality and Status of the task by clicking on the Edit icon under Actions.
Note
The SOP task cannot be edited until the SOP instance is approved.
Also, depending on the status, you can enter a comment in Add Comment. To see more tasks in the list, either select another value for Items per page, or select another page.
In the SOP Details section, you will be also be able to see the SOP Approver names. This will help in case of approval delays as the approvers then can be contacted directly.
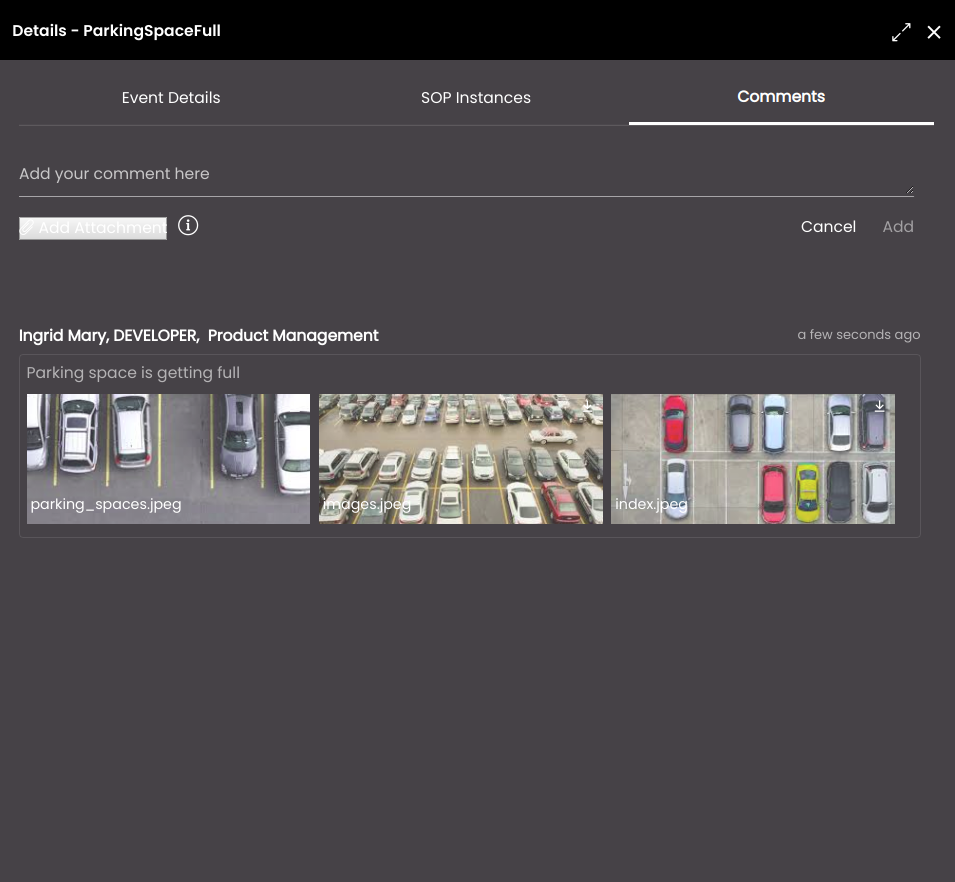
In the Comments tab, you can add a comment along with selecting images, videos or audio files from your local system as attachments to your comment.
Note
Images must be at most 2 MB and in the jpeg, png or jpg format only.
Videos must be at most 5 MB and in the MP4, ogg or mov format only.
Audio files must be at most 5 MB and in the M4A, MP3, ogg or wav format only.
Click Add to add the comment or Cancel to cancel it.
The comments will be displayed with the commenter's username, role and department. The latest comment is always displayed at the top and also all the comments given in the SOP instances tab will be displayed here. Also, the following logs will be displayed:
Operator (name/department/email) who acknowledged/dismissed the alert for the event.
Operator who clicked on the event to view the event details.
Operator who downloaded the event.
Operator who executed the event with the associated SOP.
Operator who updated the event as follows:
Changed the criticality
Added a comment
Uploaded a media
Downloaded a media
Started/Stopped a recording
Similar to the Event Details tab, a media viewer is also present to enhance the viewing of the media attachments by being able to download and maximize them and also you can carousel among the images, videos and audio files that were attached.
There is also a Magnifier toggle button in the media viewer, if enabled, displays a magnifier over the image which helps to magnify a particular portion of the image to be able to see it clearly and get into its details.
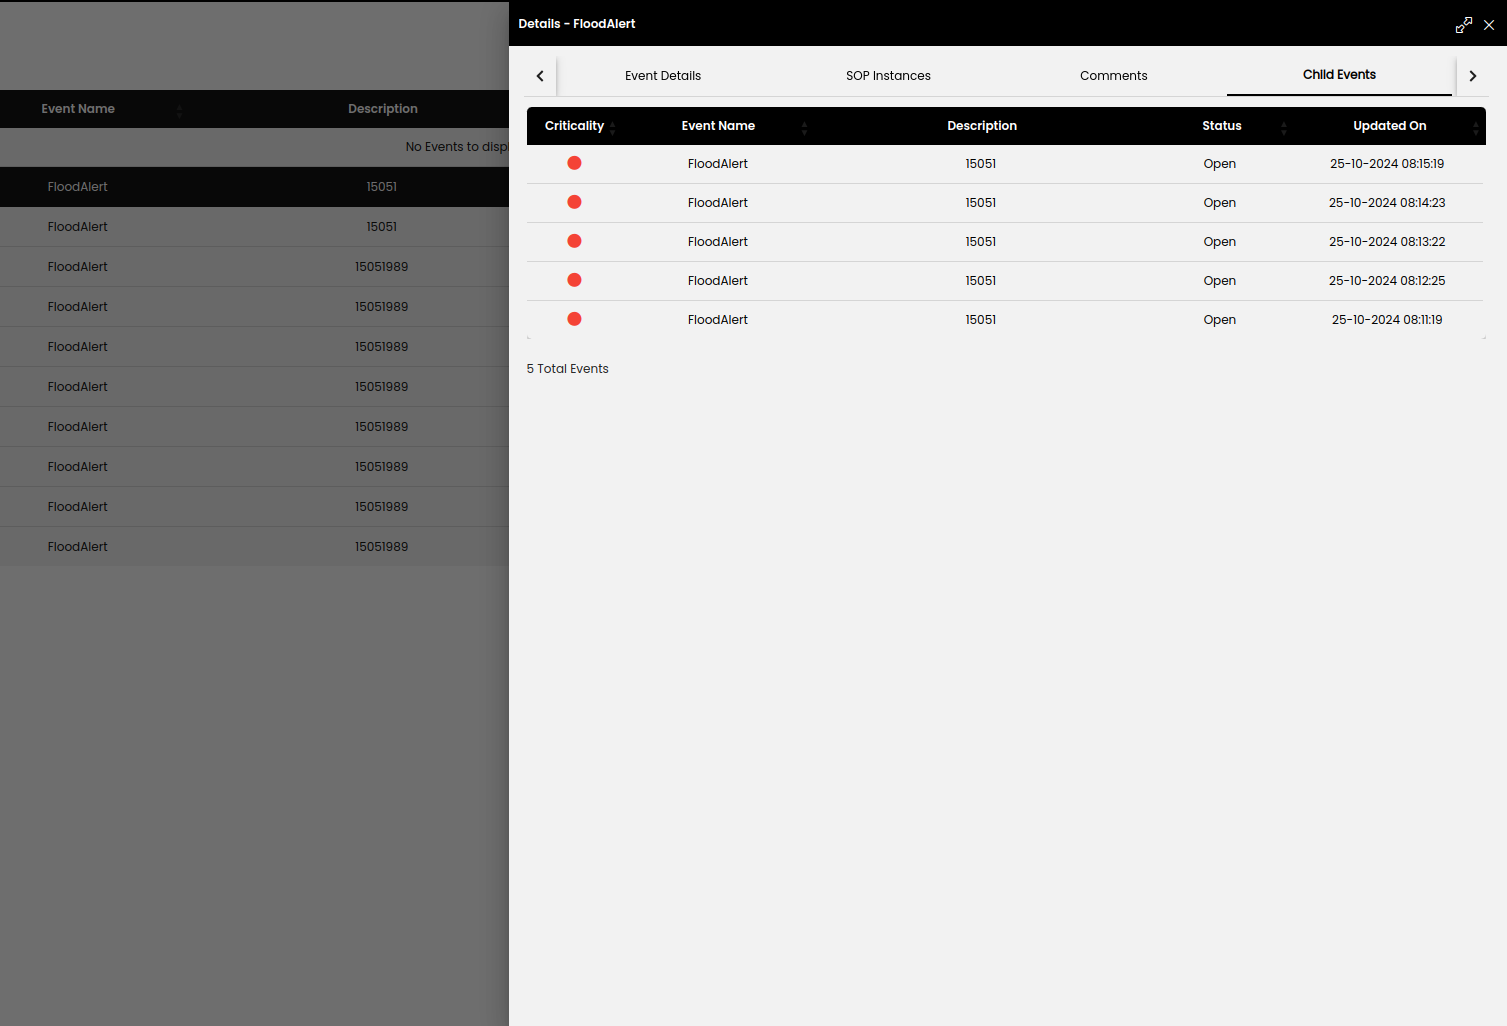
In the Child events tab, you can see all the recurring events merged under a single event until they reach to a Closed state. Notification Frequency that was set in Admin Panel > Definitions > Events is used to control the frequency of (recurring) child event notifications.
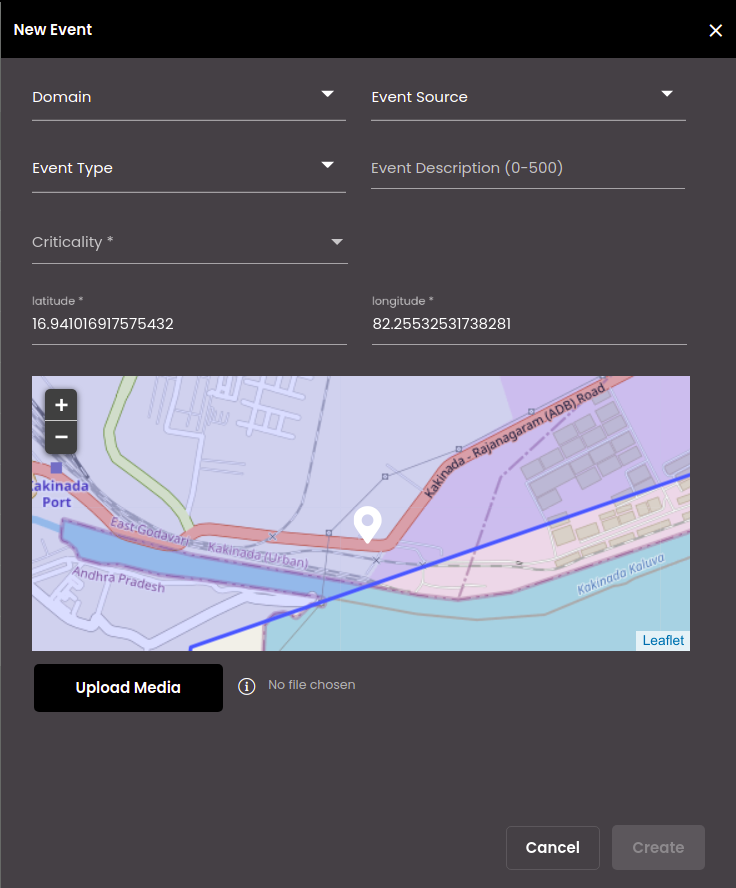
To create a manual event, you can follow the steps below.
On the right-hand side of the Events screen, click the Event icon:
 .
.Select a specific domain to be associated with this event in the Domain field.
Based on the Domain selected, select a specific event source to be associated with this event in the Event Source field.
Based on the Event Source selected, select a specific event type to be associated with this event in the Event Type field.
Optionally, enter a description for the event in the Event Description field.
Note
It must be 0-500 characters only.
Select the Criticality of the event based on its priority. The options are as follows:
Low
Medium
High
Enter the values for the entity properties that are displayed based on the Domain , Event Source and Event Type you selected.
Enter the latitude and longitude of the location of the event. Alternatively, you can select the location of the event on the map that is displayed on the right-hand side.
Select at most five media to upload from your local system for the event in the form of images, videos or audio files.
Note
Images must be at most 2 MB and in the jpeg, png or jpg format only.
Videos must be at most 5 MB and in the MP4, ogg or mov format only.
Audio files must be at most 5 MB and in the M4A, MP3, ogg or wav format only.
Click Create.
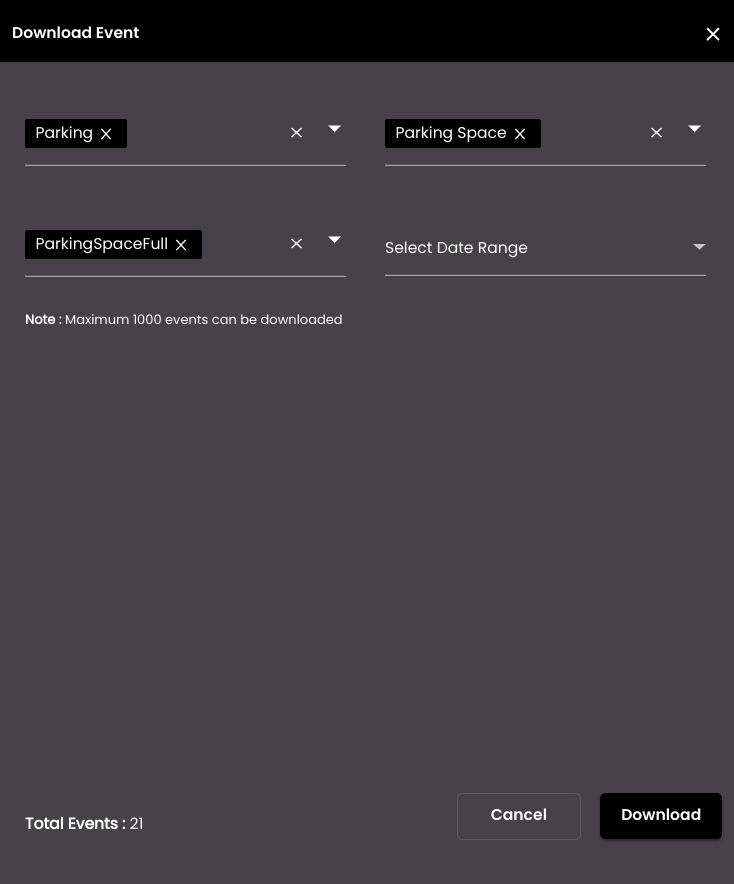
Also, to download an event, you can follow the steps below.
On the right-hand side of the Events screen, click the Download icon:
 .
.Select a specific domain to be associated with this event in the Domain field.
Based on the Domain selected, select a specific entity to be associated with this event in the Entity field.
Based on the Entity selected, select a specific event type to be associated with this event in the Event Type field.
Optionally, select a date range from the Select Date Range field.
Click Download.
The events are downloaded as a CSV file on your computer.
Note
You can download a maximum of 1000 events only.
For an Operator, Content Creator or Developer role, only certain columns which are necessary or relevant to the user will be present in the downloaded file.
To download a specific event, in the list of events, identify the event to be downloaded and click the Download icon  . The complete information of the event with its associated event details, SOP, Tasks and image attachments will be downloaded as a PDF on your computer.
To edit a specific event, in the list of events, identify the event to be edited and click the Edit icon . In the panel, you can change the criticality of the event in Criticality along with adding comments in Add Comments and then click on Update.
To execute a SOP template on the fly manually for a specific event, in the list of events, identify the event for which a SOP template is to be executed and click the Execute icon  . In the panel, you can select the SOP template to be executed, enter the email ids of additional recipients if any in Add New Recipients under the Email panel, enter the mobile numbers of additional recipients if any in Add New Recipients under the SMS panel and then click on Execute. For more information on SOP templates, see SOP Templates.
To record a specific event, in the list of events, identify the event to be recorded and click the Record icon  . A dialog is displayed for you to choose if you want to record the entire screen or a particular window or a particular Chrome browser tab containing the event. On selection, the recording of the event begins and in turn on clicking on the Stop Record icon
  , the recording of the event stops and will be saved in your downloads folder.
Note
Every minute the recording will provide a message asking if you would like to continue the recording. If you click that message, the recording will continue for another minute and after a minute it will again ask to continue and so on. However, if you don't click the message to continue, the recording automatically stops and downloads to your system.
The recording will be downloaded in the MP4 format only.