Model Performance
The Model Performance tab displays a summary of the configuration and the current status of each model that is configured in the Recommendations. Additional information can be displayed for each model to show how it is performing, and to investigate any accuracy issues.
To review how the models are performing, first navigate to the Model Performance page as detailed below:
In the top left-hand corner of the main dashboard screen, click the Manage icon:
 .
.On the Manage panel, click Recommendations
 .
.Select Model Performance.
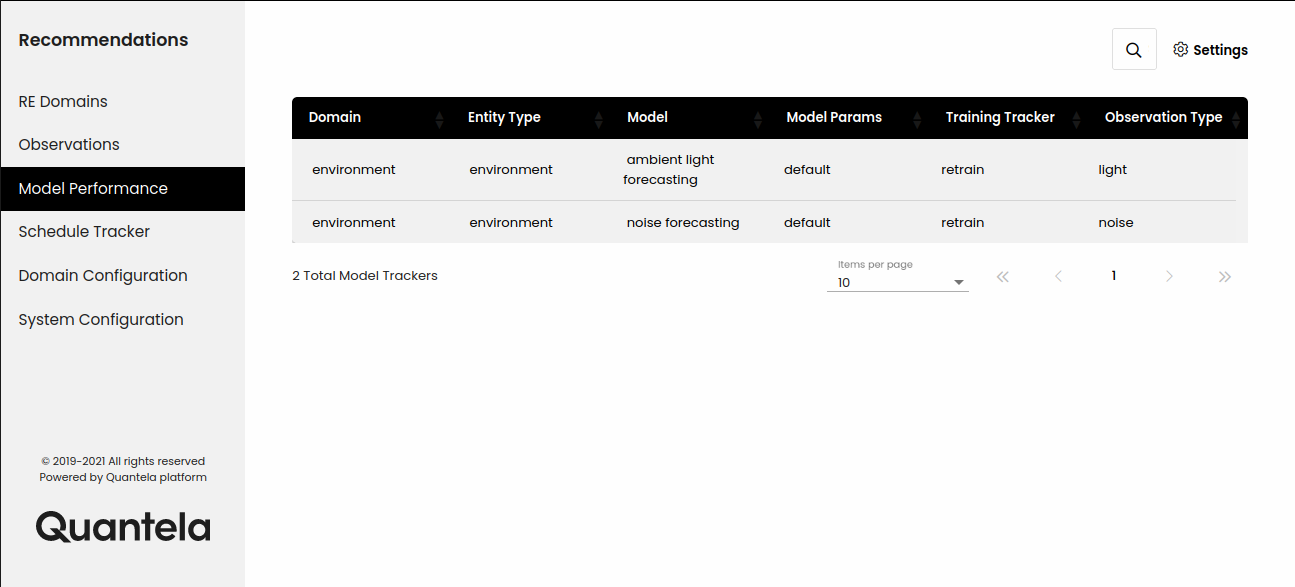
Review the list of currently configured models as illustrated below.
Note
The Model Performance tab is read-only. It allows you to monitor the performance of the Recommendations models, but not to change them.
The following information is displayed for each model.
Attribute | Description |
|---|---|
Domain | This is the functional domain that the model is associated with - for example, parking or lighting. |
Data Provider | This is a textual description of the data that the model is based on. |
Model | This is a textual description of the analytical model. You can click on the information icon to see the following model details:
|
Model Params | This is a description of the model parameters. You can click on the information icon to see more details of the specific parameters that have been used to configure this model. The parameters include default parameters that are pre-defined for this model, and hyper parameters that can be used for fine tuning the model performance. |
Training Tracker | This helps to understand the data quality and accuracy of the model. Each Recommendations model will typically be in one of three states:
|
Observation Type | This is is the output parameter for which the model is being trained. Clicking on the corresponding Information icon will display more details about the observation and its specific parameters. |
If the model is in the Training or Retraining states, then clicking on the corresponding Information icon in the Training Tracker field will display more details of the model accuracy. The Model Training Tracker Reports screen shows how the model has performed over a specific time period.
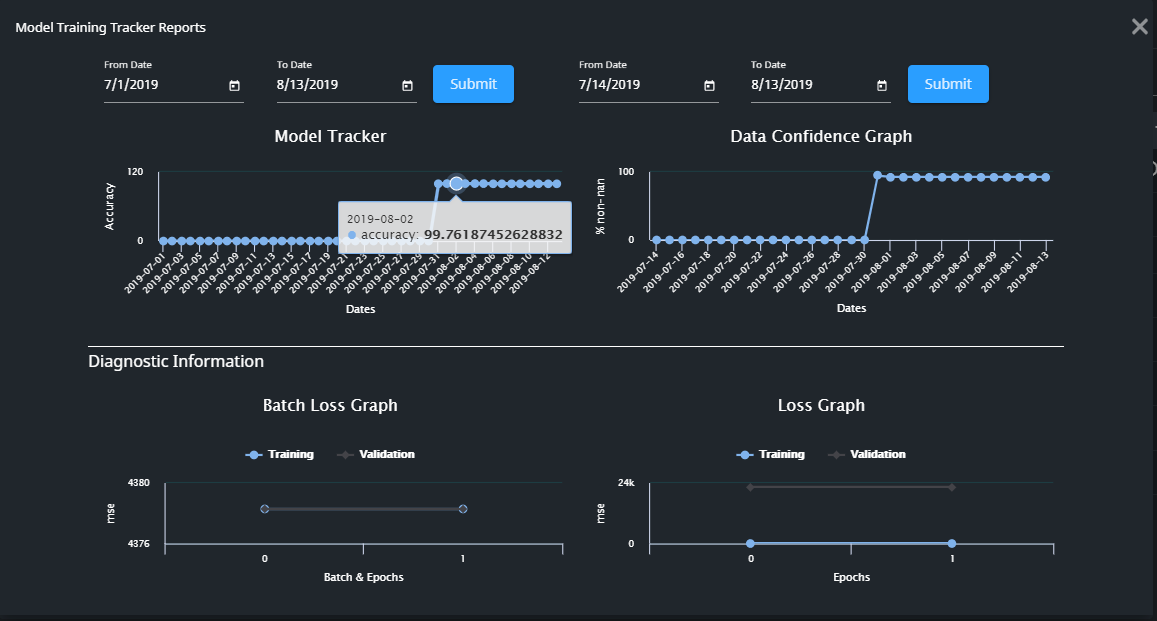
The Model Training Tracker Report consists of the following:
Accuracy Graph:
This shows the accuracy of the model performance as a reverse root mean square percentage error. The graph retrospectively compares the accuracy of the predicted value with the actual value. The higher the value, the more accurate the model was. Variation in accuracy is normal, but if it is low for a period of time then we may need to re-check the model and the input data.
There are two general cases where the model may not be performing correctly:
Data Quality - if the data quality is not good enough to learn patterns in the data then the model will not be able to converge. In this case, we should check that the data source is right, and that any transformations applied to the raw data are correct.
Model Quality - if the data quality is good but the model is still not learning then we may need to improve the model. This can be done by by optimizing the model's hyper-parameters, or by changing the complete model.
Data Confidence Graph:
This indicates the quality of training data received by the model. The graph represents the average percentage of non-NaN value data of all the sensor values received. The scale ranges from 0 to 100, and higher values represent better data.
If the data quality is not good enough to learn patterns in the data then we should check that the data source is right, and that any transformations applied to the raw data are correct.
Batch Loss Graph:
This graph indicates model loss while training, and it helps to show if the model is being trained correctly or not. The loss is calculated before optimization and after optimization of the model for each batch and all epochs. An ideal plot starts at a higher value and descends for both training and validation plots as the model converges.
The graph may indicate one of the following situations where the model is not being trained effectively:
Non-decreasing loss value - check that the data quality is good, then check the model hyper-parameters.
Training loss is decreasing but not validation - in this case the model optimization is not working as expected so we may need to change the optimization technique.
Loss Graph:
This indicates the model loss after the completion of each epoch during training. The loss is calculated separately for both training and validation data. An ideal plot starts at a higher value and descends for both training and validation plots as the model converges.
The graph may indicate one of the following situations where the model is not being trained effectively:
Non-decreasing loss value - check that the data quality is good, then check the model hyper-parameters.
Training loss is decreasing but not validation - in this case the model optimization is not working as expected so we may need to change the optimization technique.
Model overfitting - if the training loss is decreasing but the validation loss is not decreasing at the same rate and finishes higher than the training loss then the model may be overfitting. In this case, the model is too specific to the training data and is not generalized enough.
Model underfitting - if neither the training loss nor the validation loss are decreasing as expected then the model may be underfitting. In this case, the model is not be able to learn the pattern of the data.