Display of progressive rendering in a map widget
The streams functionality of datasets has been utilized in order to render the markers on the map widget progressively instead of loading all the markers data from the dataset at the same time. This means that after the map widget configuration is complete and while the markers are getting drawn on the map, they will be displayed in stages thus producing an animated effect till all of them are rendered on the map. This approach helps in faster display of the map markers even if the data is huge.
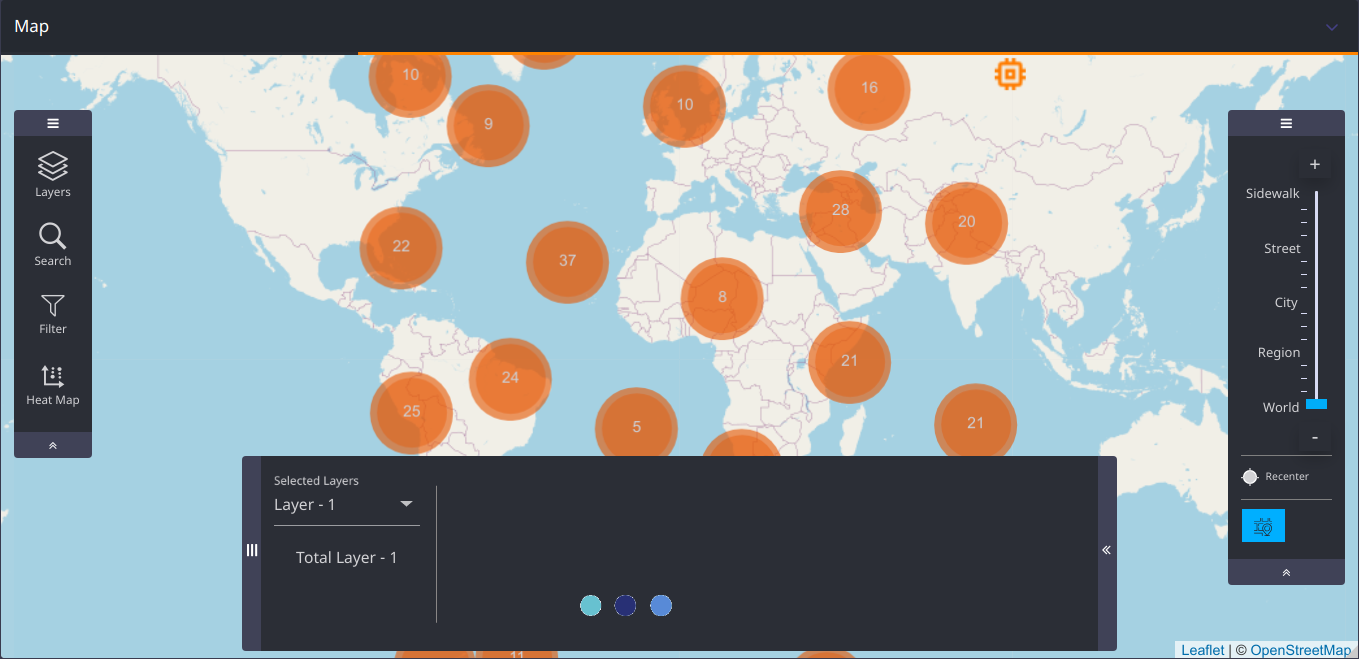
In the following example, you can see that on loading, initially a few markers are displayed as shown in the figure below:
Later once all the markers are loaded they are shown as in the figure below:
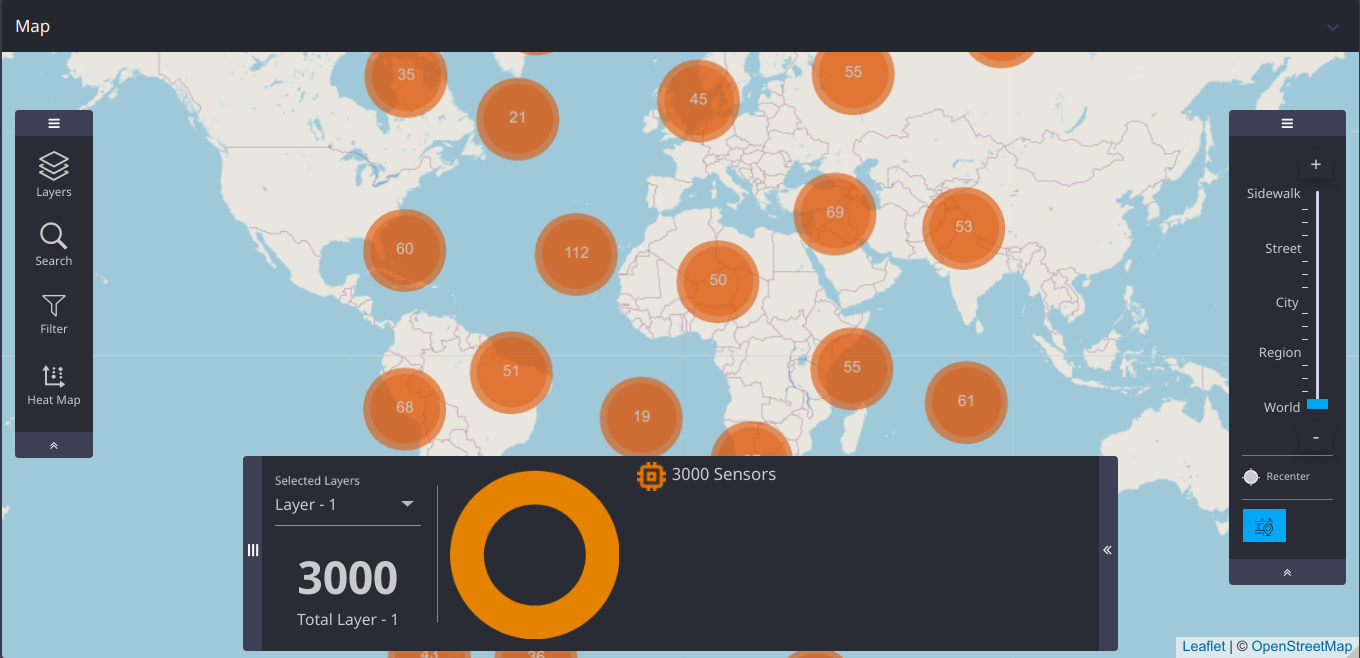
Note the difference in the cluster count in the two images which is due to the gradual addition of the map markers on the map.
Note
The Summary Panel, Filter and Heat Map are only displayed after all the markers are drawn on the map.