Logs
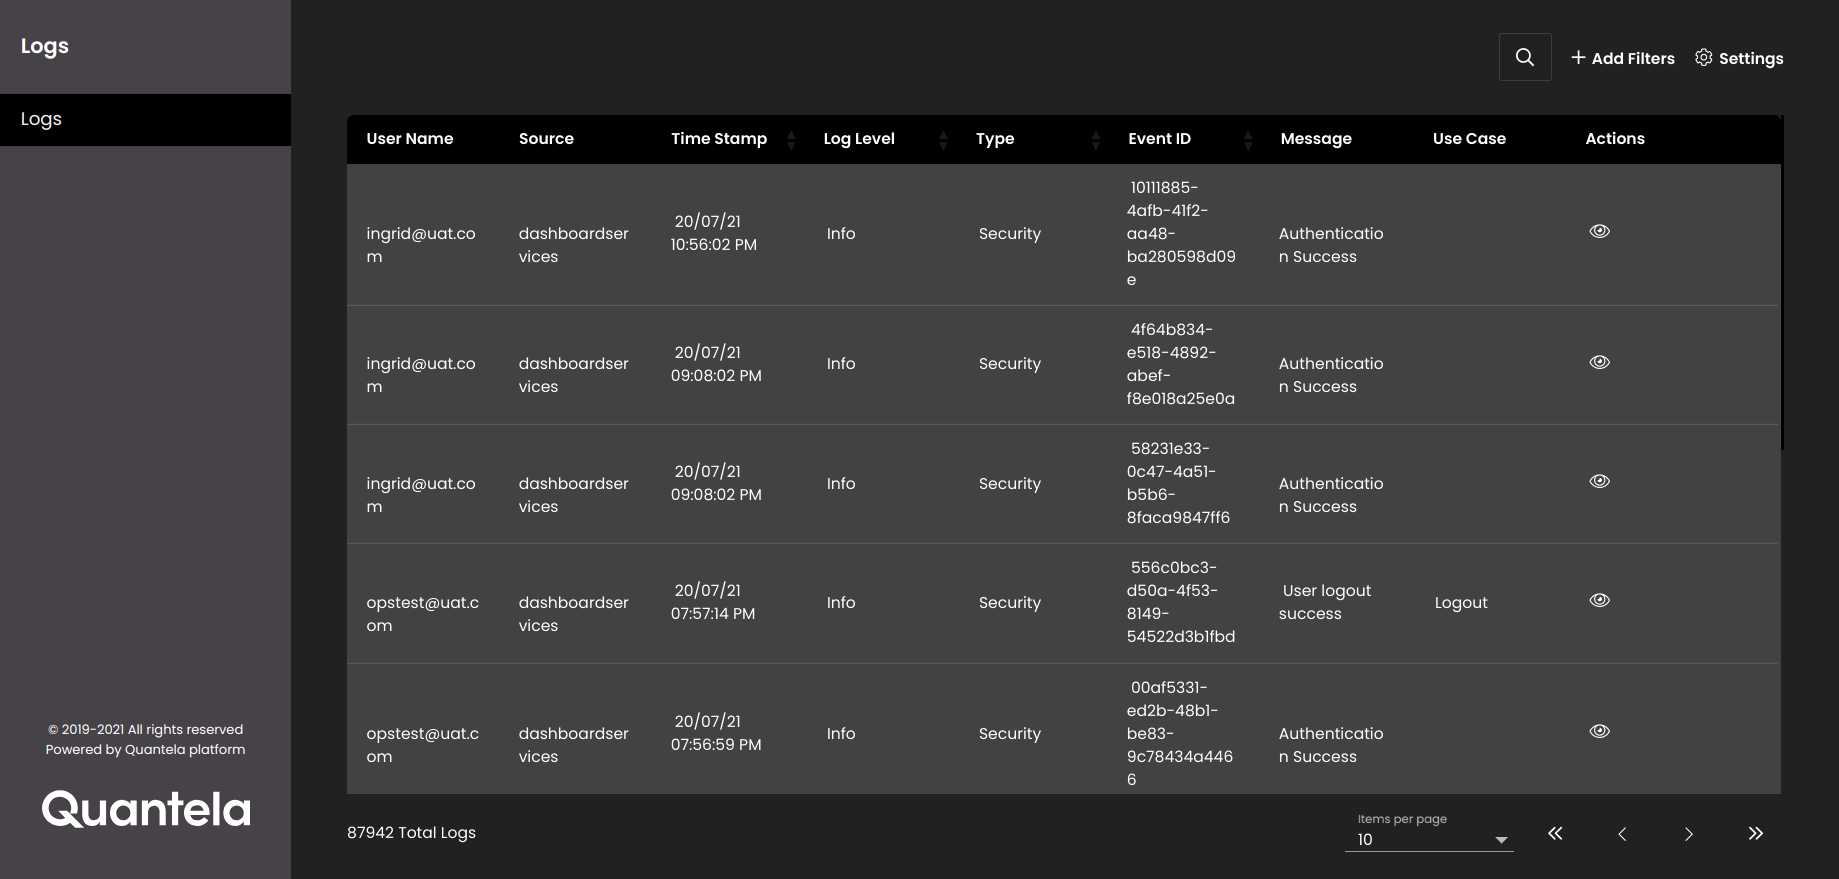
The Quantela platform continuously stores log messages to an Elastic Stack logging platform. The Logs facility in the Quantela platform can be used by suitably authorised operators to search for and display detailed information about specific system events.
To view the system logs, first click the Admin Panel icon in the top left-hand corner of the main dashboard screen:  .
.
On the Admin Panel, click Logs:  .
.
To filter the displayed logs, click the Add Filters icon  .
.
Select which log you are interested in from the Type list. There are two log types available:
Security - this includes details of events related to users, roles and regions.
Microservice - this contains details of system events, and is mostly used by engineers for investigating system performance.
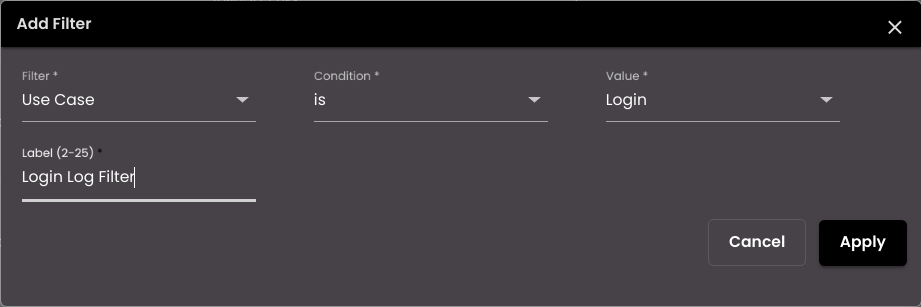
Press the Add Filter button to create one or more search filters. For each filter, configure the following parameters:
Filter parameter | Description |
|---|---|
Filter | Select the attribute that you want to filter on. The attributes that are displayed in the list depend on the log type but they include the following:
|
Condition | Choose one of the following:
|
Value | Specify the value to be compared with the Filter attribute selected above. |
Label | Enter a descriptive label for this filter. |
Press the Apply button to apply this filter. To subsequently edit the filter, click on the 'pencil' icon beside the filter name. To remove the filter, click the 'cross' icon:  .
.
To search for any text within the currently displayed log messages, enter your text in the Search Logs panel which is displayed on clicking the  icon.
icon.
To see more log messages in the list, either select a larger value for Items per Page, or select another page number.
To export the displayed log messages, press the Export button at the bottom of the Add Filters section. The log messages would be saved in CSV format to your local device.