Real-time update in a map widget
The map widget can display the near real-time activity of the map markers by using the streams functionality of datasets. This has been achieved by using the progressive rendering in a map widget, see Display of progressive rendering in a map widget.
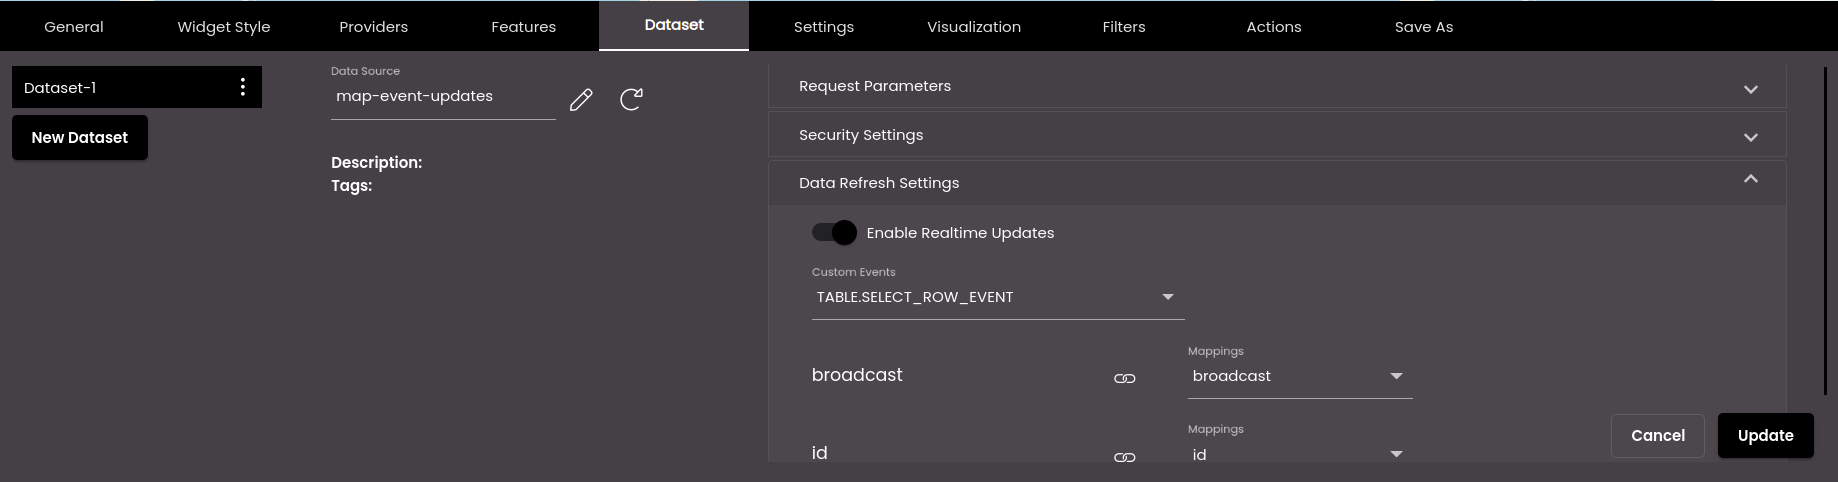
Firstly, to allow the real-time update in the map widget, the Enable Realtime Updates option should be enabled in the Data Refresh Settings of the Dataset tab.
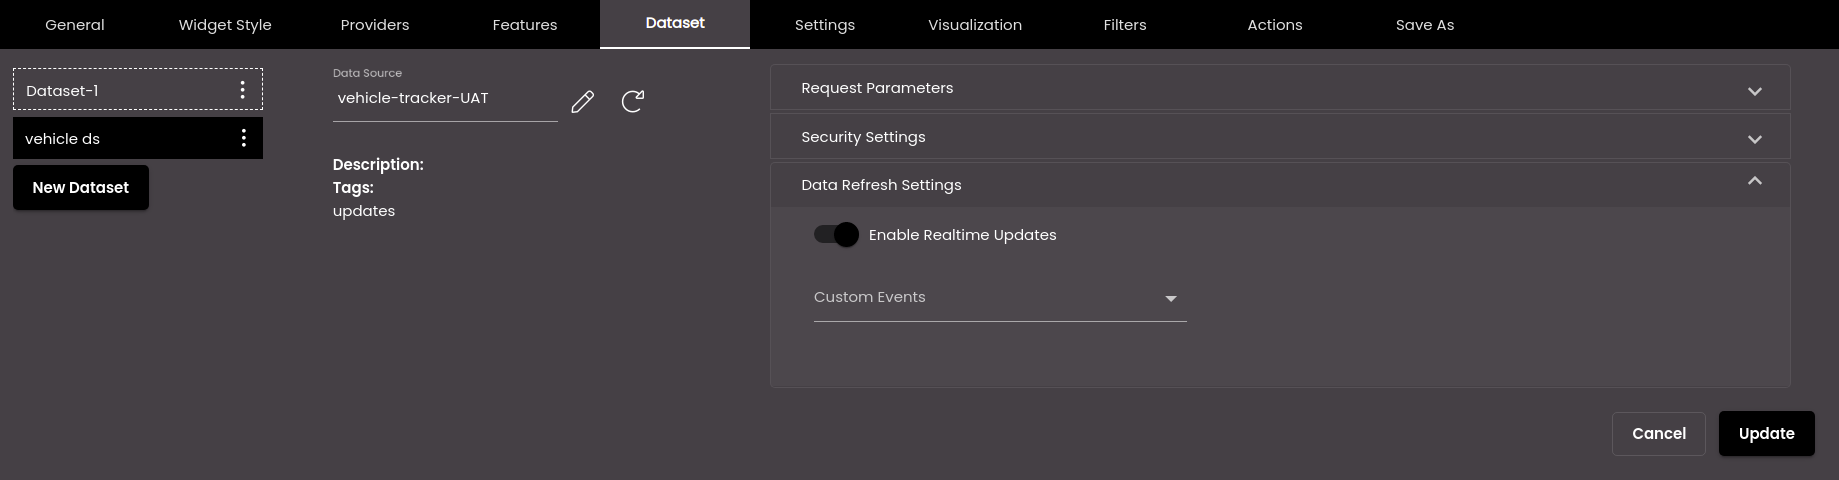
This Enable Realtime Updates option will be displayed only if the selected dataset has the BuiltIn-Publisher selected in it. For information see, Create a dataset.
Also, if you need to see the movement only certain markers, in the Custom Events panel, you can select the event(s) on which the information from the data source should be updated. This will help you to see the movement of only the desired markers on the map based on the event that is selected.
Configure the rest of the settings in the map widget as described earlier.
Note
The Summary Panel, Filter and Heat Map are only displayed after all the markers are drawn on the map.
The automatic zoom functionality does not occur for each progressive rendering of the markers on the map. It occurs only once all the markers are drawn on the map.
It is suggested not to enable the Summary Panel if the widget receives frequent updates in order to have optimal performance.
It is suggested to show a dynamic popup if the widget receives frequent updates as opening a static popup also impacts the real-time updates.
It is suggested that the update time for the socket is at least 15 seconds (tested with 200 markers) so that the performance is optimal.
Once all the configuration settings are done you can see the real-time updates in the map widget.
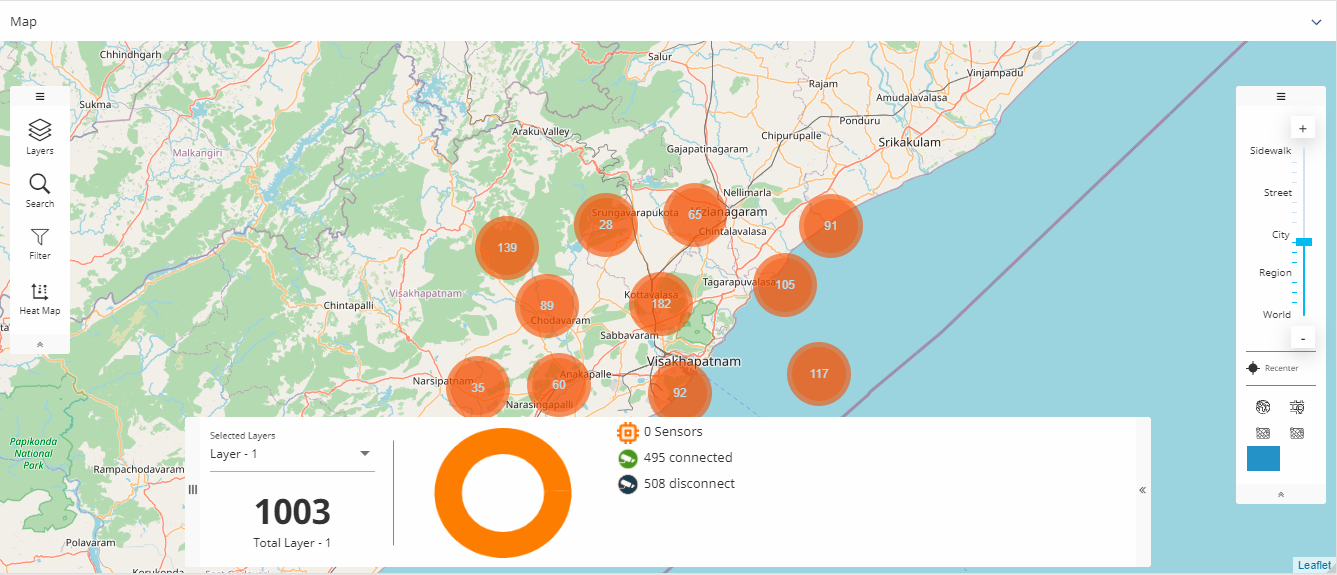
In the following example, you can see that once all the markers are loaded, the Summary Panel displays the markers total count as 1000 of which 493 are connected and 507 are disconnected as seen in the figure below:

Later there was an update in the markers and the changes were automatically reflected on the map. The Summary Panel now displays the markers total count as 1003 of which 495 are connected and 508 are disconnected as seen in the figure below:
Using real-time updates we can also view the route taken by the markers. In order to view that we need to follow the steps below:
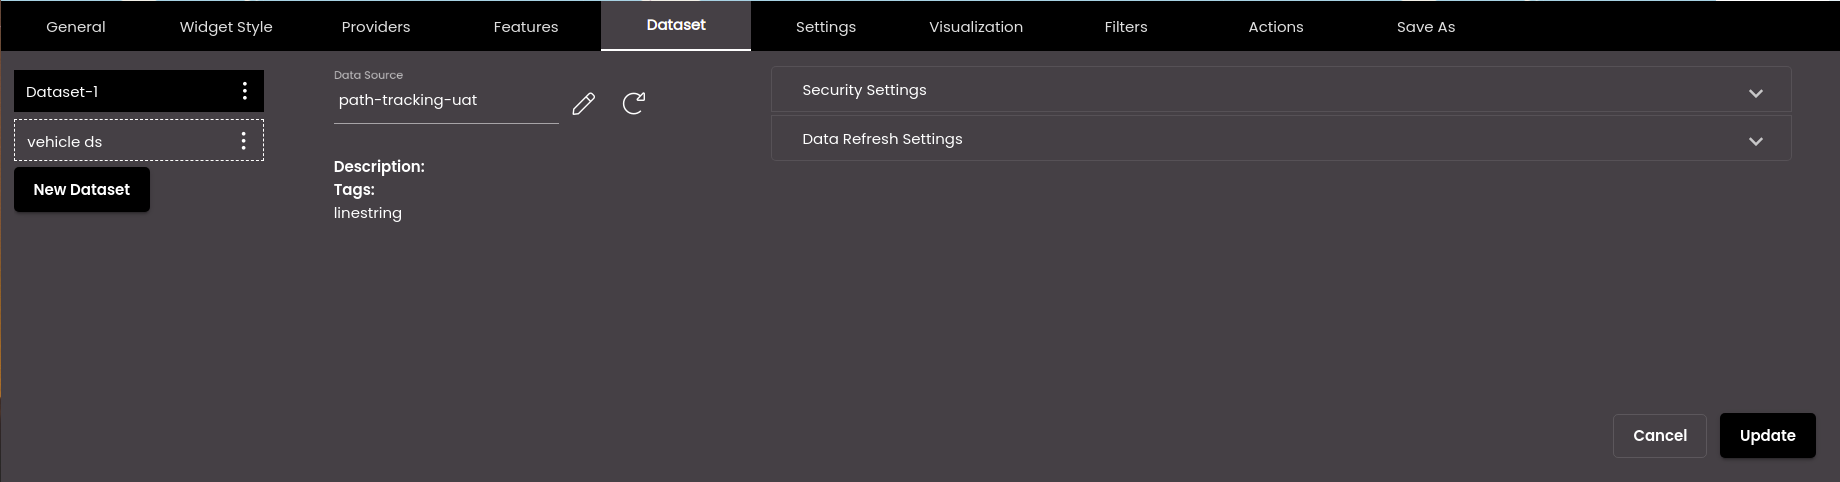
As mentioned earlier, enable the Enable Realtime Updates option for your dataset in the Data Refresh Settings of the Dataset tab. Also, during dataset creation, the Tags field has to be the text updates so that it is displayed here to view the route of the markers. For more information, see Create a dataset.
Select another dataset in the Dataset tab that contains the pre-defined route information. This dataset will be called the Mapping Dataset in the Settings tab and will be used to show the route of the marker smoothly even if the updates are not received at regular intervals of time. Also, during dataset creation, the Tags field has to be the text linestring so that it is displayed here to view the pre-defined oute of the markers. For more information, see Create a dataset. If you need to see the pre-defined route of the markers then create another layer in the Settings tab for this dataset.
Configure the map widget settings in the Settings tab as mentioned earlier. Apart from the previous settings there are a few additional settings as mentioned below:
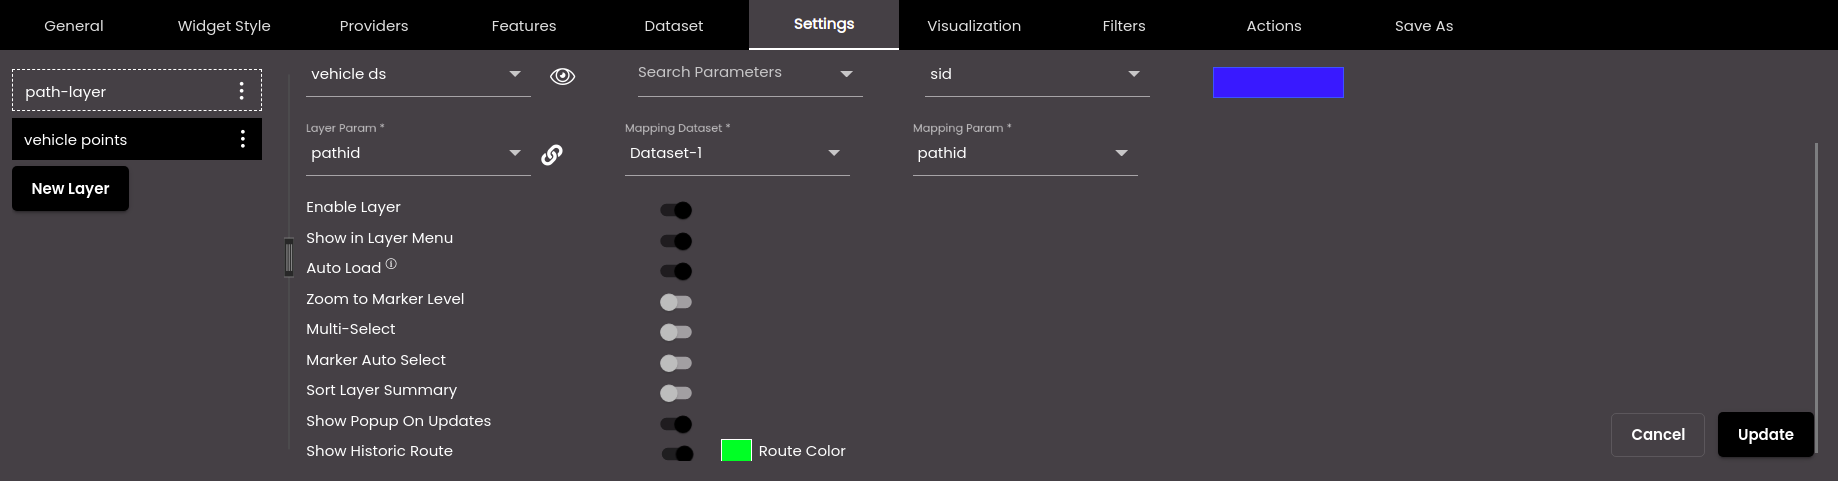
Setting
Description
Layer Param
A property in the first dataset which relates to the Mapping Param. For example, if your first dataset has a property
pathIdthen the Mapping Dataset too should have thepathIdproperty.Mapping Dataset
The second dataset which contains the pre-defined route information and is used to show the route of the marker smoothly.
Mapping Param
A property in the Mapping Dataset which relates to the Layer Param. For example, if your first dataset has a property
pathIdthen the Mapping Dataset too should have thepathIdproperty.Show Popup On Updates
Displays a popup to show the marker details when the markers receive updates.
Show Historic Route
Displays the last five points as a route on the map.
Route Color
The color of the route drawn on the map.
Also, based on the Palette in the Widget Style tab, a set of Preset colors are available to directly choose from, which if selected, change based on the theme.
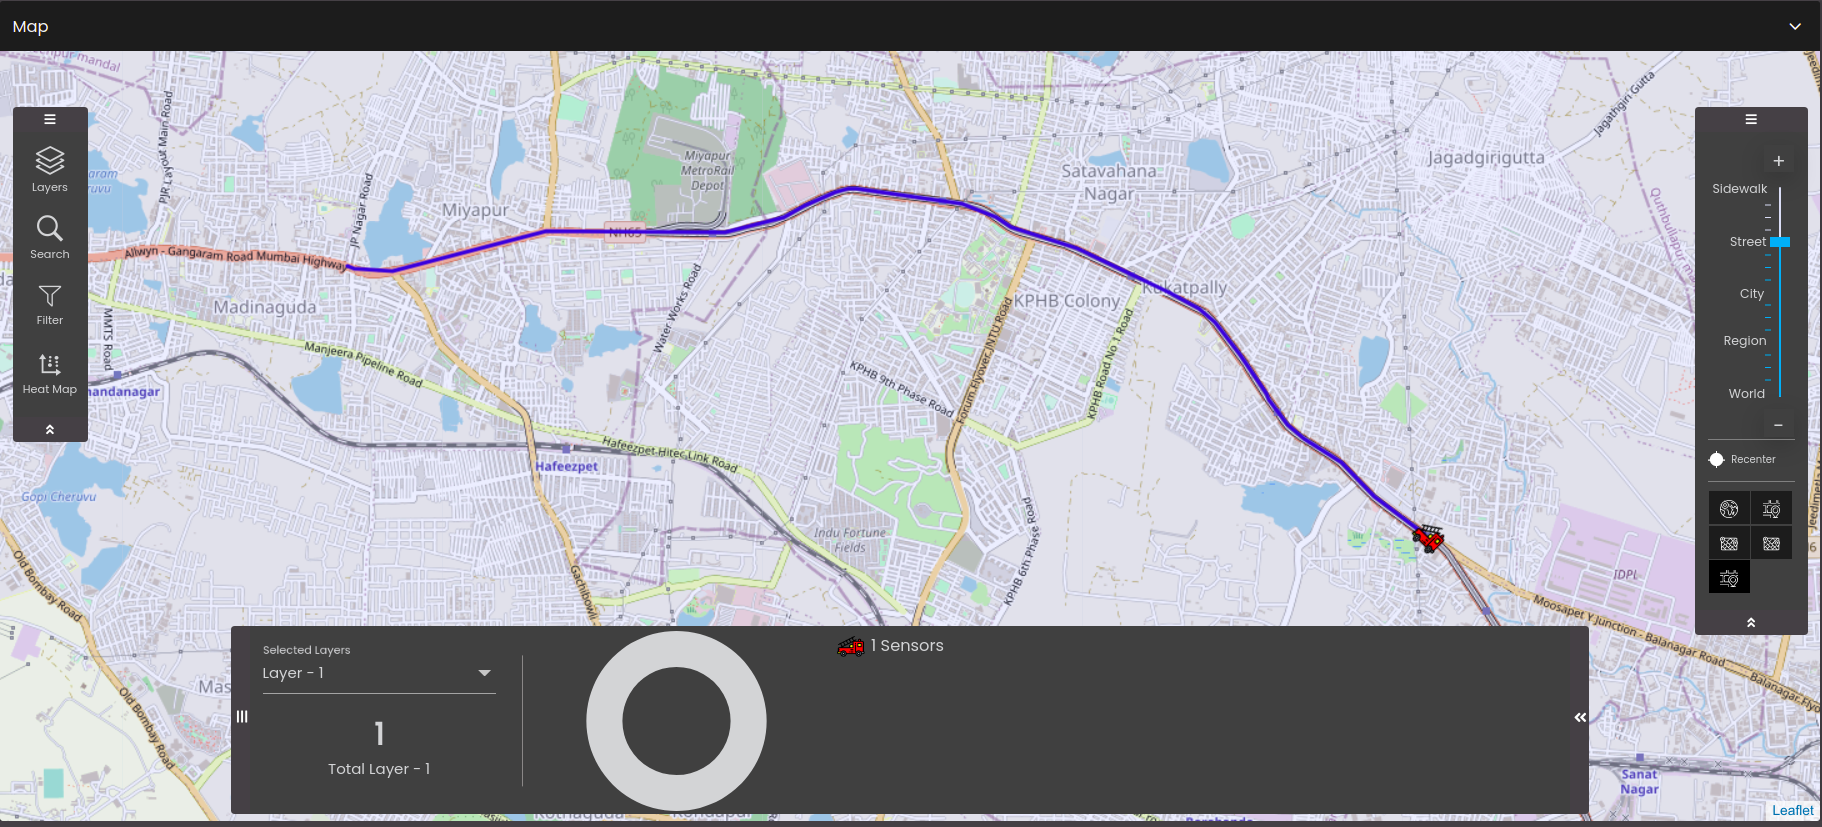
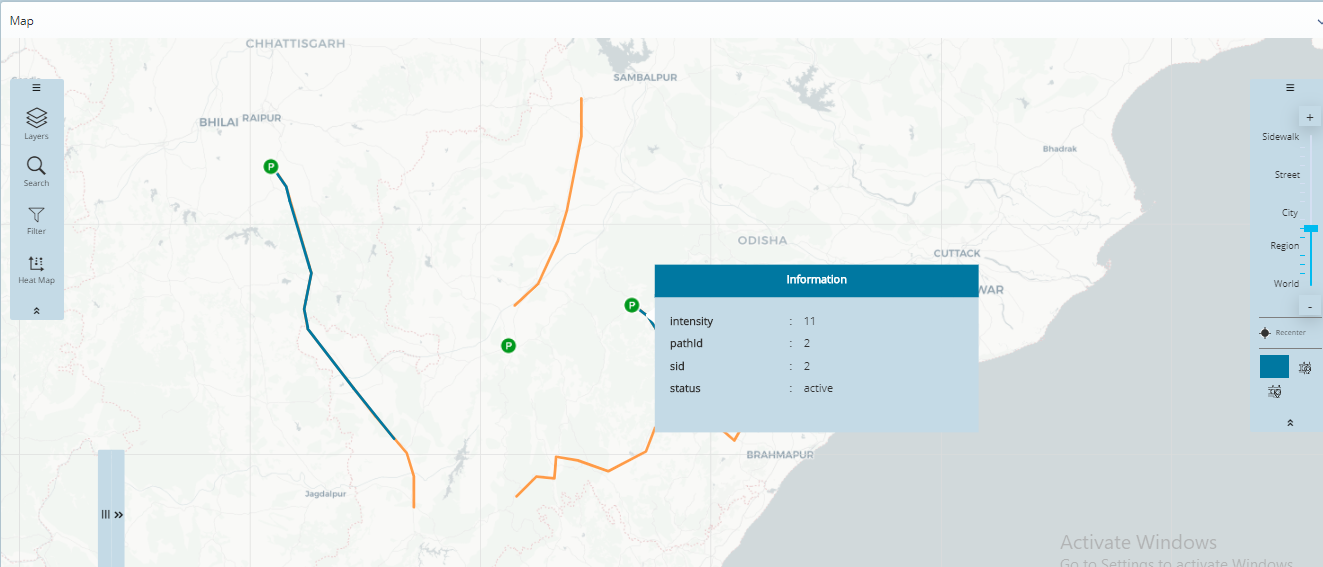
Once you have configured all the above settings you are ready to view the real-time tracking on the map. So whenever the map marker receive updates, the last five points of the marker are displayed as a route on the map as seen in the figure below:
Using real-time updates we can also track the movement of only certain markers on the map based on an event. In the following example, we will be tracking the individual markers by selecting the rows of a Datagrid. In order to do that we need to follow the steps below:
As mentioned earlier, enable the Enable Realtime Updates option for your dataset in the Data Refresh Settings of the Dataset tab. Also, in the Custom Events panel, select the event(s) on which the information from the data source should be updated. This will help you to see the movement of only the desired markers on the map based on the event that is selected.
If you want to display the pre-defined route, you can configure it as mentioned in Step 2 and Step 3 in the previous example.
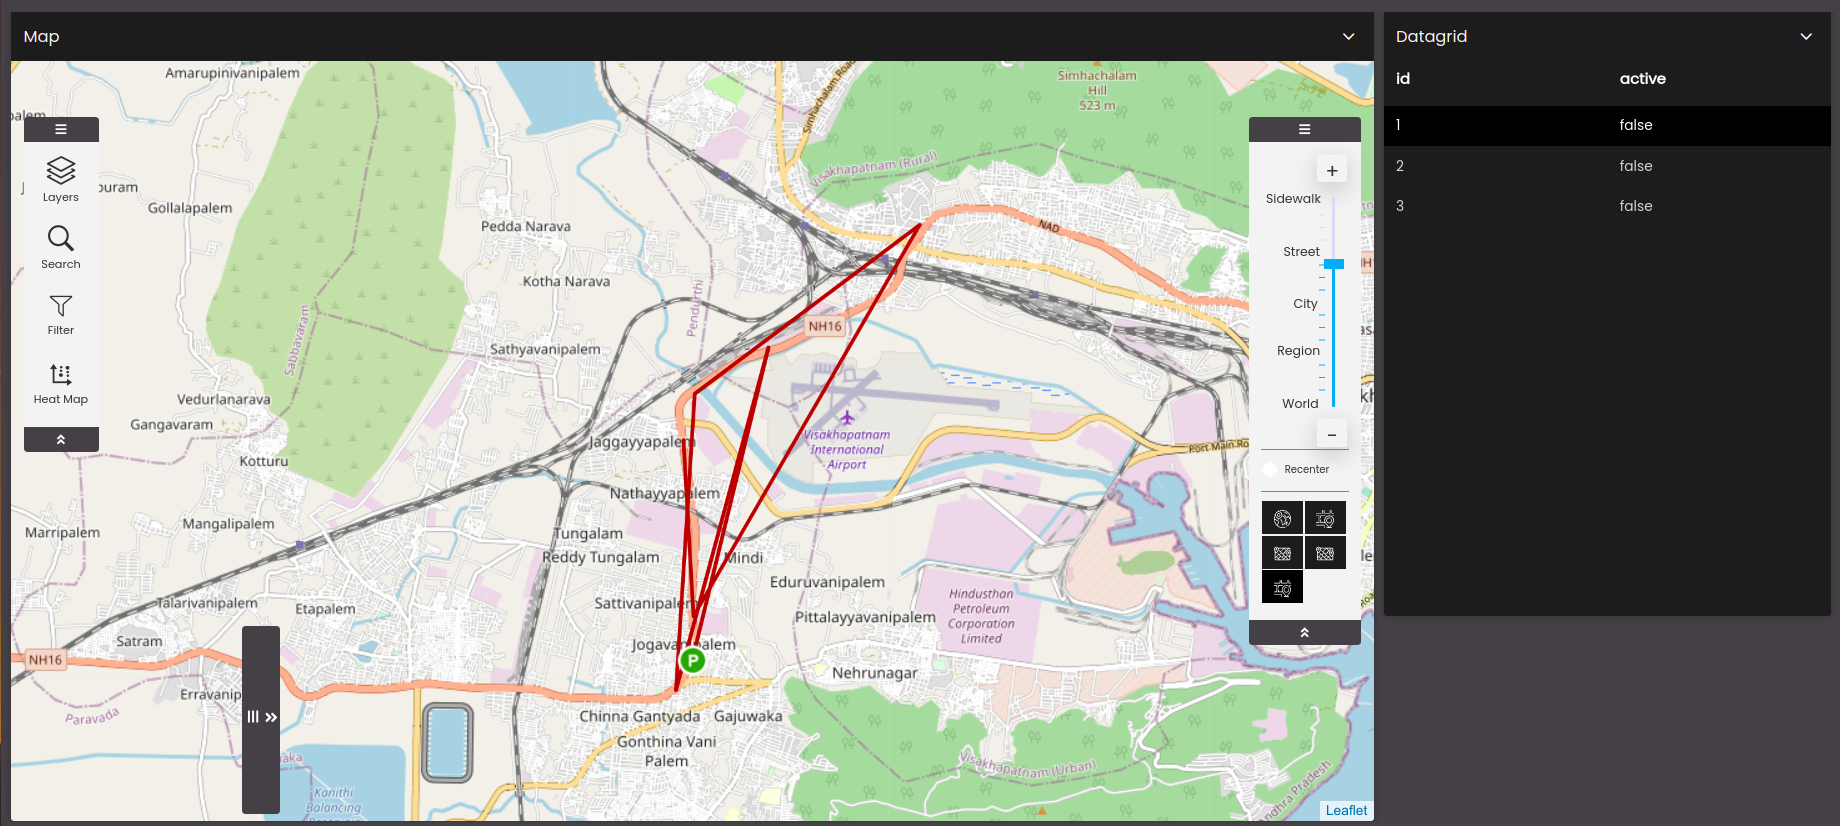
Configure a datagrid widget and the selection of rows in the datagrid widget to raise events to this map widget based on the selection.
Once you have configured all the above settings you are ready to view the real-time tracking of particular markers on the map. Select a row from the datagrid widget and accordingly the route of that particular sensor will be shown on the map. The last five points of the marker are displayed as a route on the map as seen in the figure below:
Note
Only the updation and deletion of the existing markers are allowed and not the addition of new markers.
Using real-time updates we can also know the direction in which the vehicle is pointing towards so that it provides the sense of direction in which the vehicle is moving or parked. In order to view that we need to follow the steps below:
As mentioned earlier, enable the Enable Realtime Updates option for your dataset in the Data Refresh Settings of the Dataset tab.
Configure the map widget settings in the Settings tab as mentioned earlier. Apart from the previous settings there are a few additional settings as mentioned below:
Setting
Description
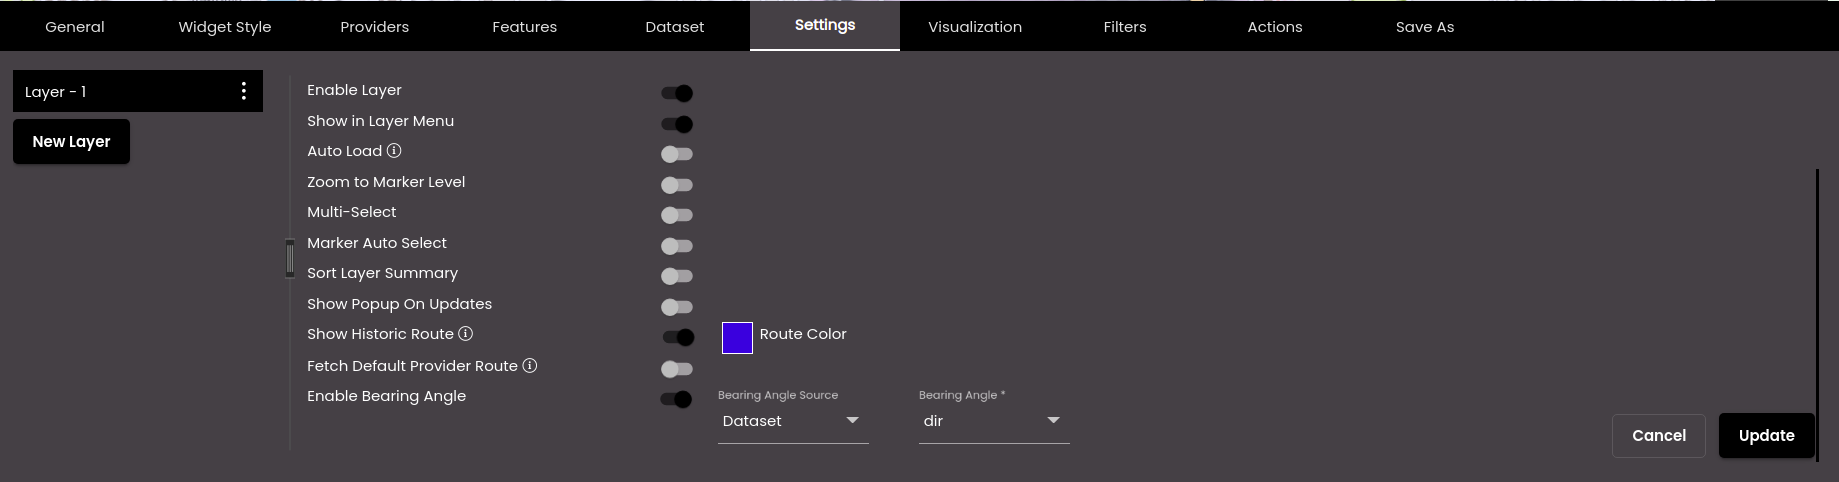
Fetch Default Provider Route
Fetches the route from the default route provider configured in Configure route configurations.
Note
This is a beta feature and should be enabled cautiously as it may affect the performance. It may cause slowness as the routes are fetched from the route provider. Disable this feature in case any slowness is observed.
Enable Bearing Angle
The angle at which the vehicle/marker is to move. If enabled, it displays the Bearing Angle Source.
Bearing Angle Source
The source of the bearing angle. It is displayed when Enable Bearing Angle is enabled. It can be any of the following:
Dataset - The dataset that is selected. If selected it displays the Bearing Angle drop-down from which you can select the column from the dataset that contains the bearing angle.
Manual - The calculation of the bearing angle will be done internally within the platform.
Note
The calculation is done based on the latitude and longitude of the source and destination.
Configure the map widget settings in the Visualization tab as mentioned earlier. Apart from the previous settings, if required, enter a Rotation Angle in the Default Icon panel which will be the initial angle at which the vehicle/marker is positioned. The default value is 0.
Once you have configured all the above settings you are ready to view the real-time direction of the vehicle/marker movement on the map. So whenever the map marker receive updates, the vehicle/marker moves on the map in the direction set as seen in the figure below: