Filter dashboard on time period
You can filter the information that is displayed on a dashboard so that it displays information only for a particular time interval.
In the top left-hand corner of the main screen, click the Dashboards menu icon.
Click Dashboard Settings at the bottom of the panel.
In the dialog box that is displayed, click the Filters tab.
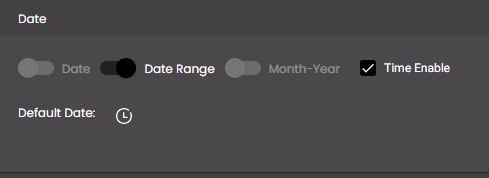
Enable the Date filter.
Note
If disabled, it doesn't display the date filter on the dashboard header bar. Hence, you will not be able to select a particular time interval for which the current dashboard displays information.
Click the Date drop-down list which shows the following:
Setting
Description
Date
Displays the Default Date and to select a specific date for which the current dashboard should display information.
If Date, Date Range and Month-Year are disabled, then it doesn't display Default Date.
Date Range
Displays the Default Date and to select a date range for which the current dashboard should display information. Also, to set a specific time for the selected date range, select Time Interval.
If Date, Date Range and Month-Year are disabled, then it doesn't display Default Date .
Month-Year
Displays the Default Date and to select a particular month and year for which the current dashboard should display information.
If Date, Date Range and Month-Year are disabled, then it doesn't display Default Date.
Default Date (shown if either Date, Date Range or Month-Year are enabled)
The default time period for which the current dashboard should display information. The default date set here is displayed on the dashboard header bar in order to understand the time period for which the current dashboard is showing the information.
If Date Range is enabled, in the Date drop-down, for Default Date, do one of the following:
which denotes
current timestamp – 6 hoursFor example,
2019-12-12 06:52:42 to 2019-12-12 12:52:42Note
The time period shown next to the icon changes depending on what period was last selected.
which denotes
current timestamp – 7 days ago current timestampFor example,
2019-12-05 12:51:09 to 2019-12-12 12:51:09The keys being sent in the dashboard object are as follows:
formattedFromDate: "19-05-2023 00:00:00"formattedToDate: "25-05-2023 23:59:59"from: "now-7d/d"fromDate: 1684434600000to: "now/d"toDate: 1685039399000isoFromDate: "now-7d/d"isoToDate: "now/d"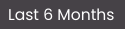
which denotes
current timestamp – 6 months ago current timestampFor example,
2019-06-12 12:53:56 to 2019-12-12 12:53:56
which denotes
current timestamp – 1 year ago current timestampFor example,
2018-12-12 13:02:28 to 2019-12-12 13:02:28Note
Start of the week is Sunday.
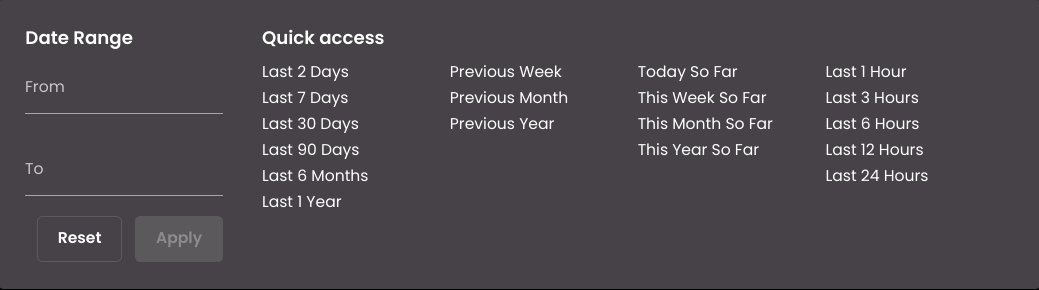
In the Date Range drop-down, do one of the following:
Under Date Range, specify the dates and times that indicate the start and end of the time period. Click Apply and close the drop-down.
The keys being sent in the dashboard object are as follows:
formattedFromDate: "19-05-2023 00:00:00"formattedToDate: "25-05-2023 23:59:59"from: "19-05-2023 00:00:00"fromDate: 1684434600000to: "25-05-2023 23:59:59"toDate: 1685039399000isoFromDate: "2023-05-19T00:00:00+05:30"isoToDate: "2023-05-25T23:59:59+05:30"Under Quick access, click one of the available time periods.
Click Reset to clear the time period last selected.
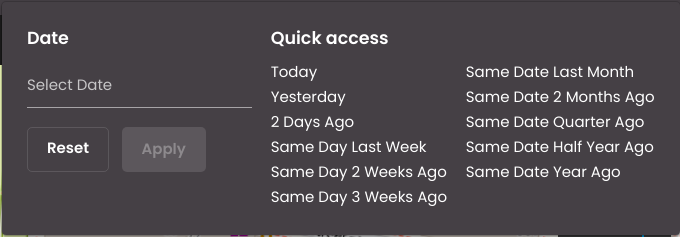
If Date is enabled, in the Date drop-down, for Default Date, do one of the following:
Under Date, specify the exact date. Click Apply and close the drop-down.
The keys being sent in the dashboard object are as follows:
formattedFromDate: "25-05-2023"from: "25-05-2023"fromDate: 1685022332000isoFromDate:"2023-05-26T19:15:34+05:30"Under Quick access, click one of the available time periods.
For example, for Yesterday, the keys being sent in the dashboard object are as follows:
formattedFromDate: "25-05-2023"from: "now-1d"fromDate: 1685022239000isoFromDate:"now-1d"Click Reset to clear the time period last selected.
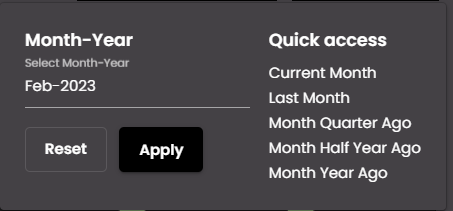
If Month-Year is enabled, in the Date drop-down, for Default Date, do one of the following:
Under Month-Year, specify the exact year and month. Click Apply and close the drop-down.
The key being sent in the dashboard object is as follows:
month: "Jun-2022"Under Quick access, click one of the available time periods.
For example, for Last Month, the key being sent in the dashboard object is as follows:
month: "Apr-2023"Click Reset to clear the time period last selected.
Select the date option for which you want to see information on the dashboard.
Click Update.
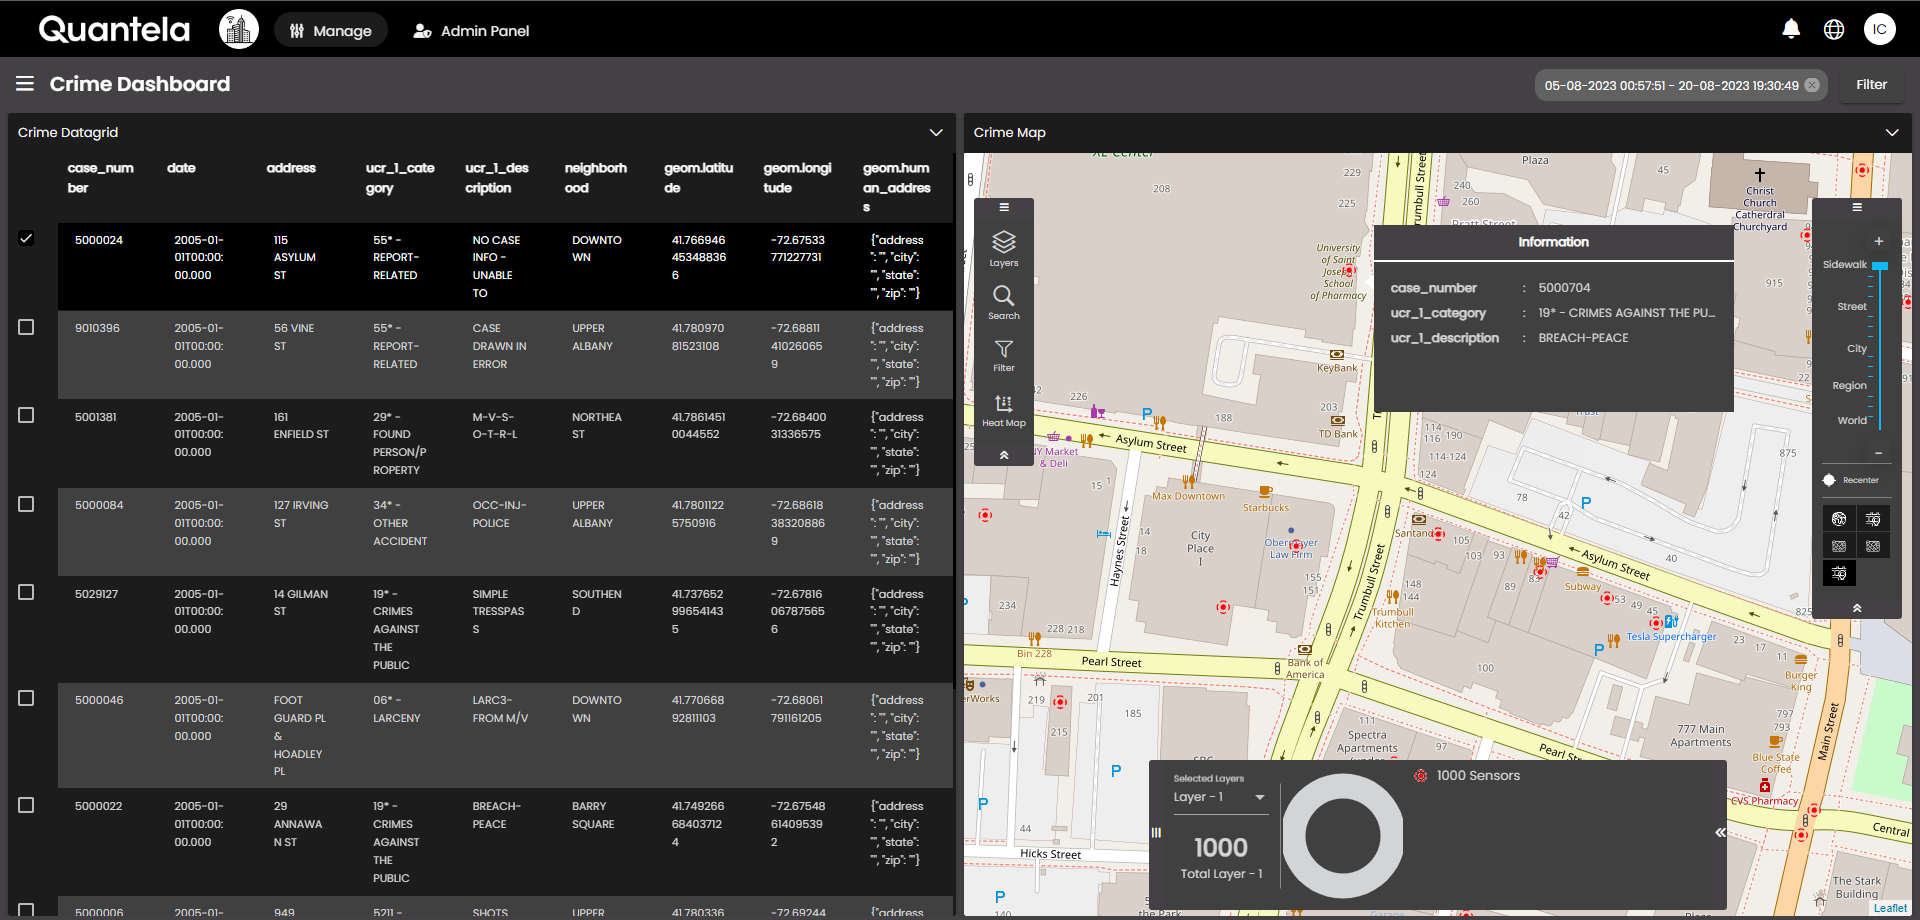
The dashboard is updated so that it displays only information that is relevant to that time period. Also, the selected time period is displayed as a 'chip' on the right-hand side of the dashboard:
If you click on the chip, it will open the Date filter drop-down from which a time period can be selected based on the time period enabled in the Date drop-down in Dashboard Settings > Filters tab.
A Filter Preview button is also present, next to the chip, which on clicking displays the Date filter drop-down from which a time period can be selected based on the time period enabled in the Date drop-down in Dashboard Settings > Filters tab. Press the Apply button to apply this filter. To reset the filter, click on Clear All in the filters panel.
Also, to clear the selected time period you can click on the
 icon in the chip on the dashboard or Filters panel.
Note
To enable a widget to display information that changes dependent on the time period selection, you must also select DASHBOARD.DATE_RANGE_CHANGE_EVENT in the list of Refresh Events in that widget's configuration. For more information, see Configure dashboard events.