Configure widget dataset
The widget dataset specifies the data source from which the widget retrieves information to display. For example, to display lighting information, a map widget needs to connect to a data source that contains data from sensors about each street lamp. Each type of widget needs the data to be in a particular format. For example, chart widgets need data in CSV (tabular) format.
Some data sources require parameters to be passed so that they can return information to display.
You can specify the event(s) on which the information from the data source should be updated. For example, you can specify that the information should be updated when the user selects a different Region in the Region drop-down list at the top of the main screen.
If the widget configuration dialog box is not already open, do as follows:
If the widget is on a Grid layout dashboard, click the Menu icon
 in the top right-hand corner of the widget and select Settings.
If the widget is on a Fluid layout dashboard, on the floating toolbar for the widget, click the Settings icon:
.
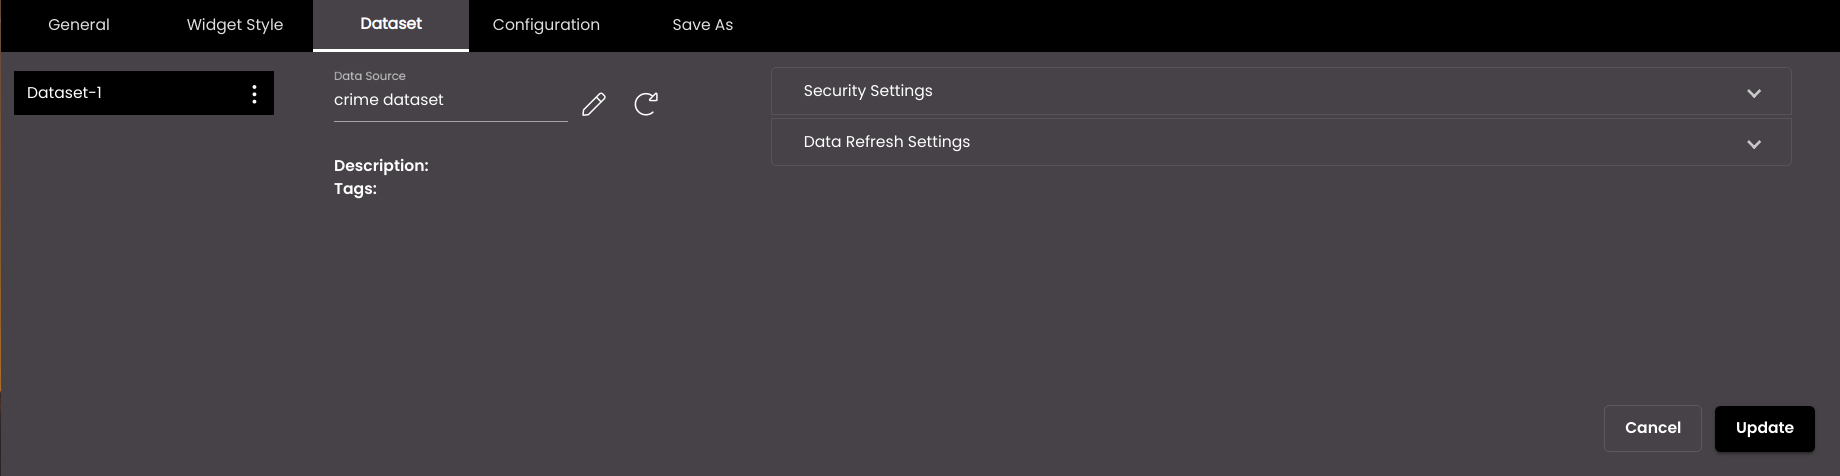
In the widget configuration dialog box, click the Dataset tab.
Click New Dataset.
A new dataset is created for you to configure.
On the left-hand side of the tab, you can rename the dataset. Click the Actions icon
 and then click the Edit icon. Enter the new name and click the Update icon.
You can also translate this text by clicking on the Translate icon
 and entering the translation of the desired language selected. Auto-suggestions are also available where the reused contents are auto-suggested.
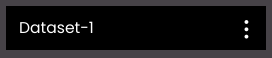
In the Data Source box, select the data source from which you want to display information. The list is populated with the data sources that have already been set up and is automatically filtered on the data source type that is appropriate for the widget type:
Widget type
Data source type
No. of datasets allowed
Chart
CSV
2
Datagrid
CSV
1
Data Selector
CSV
10
HTML
JSON
2
Iframe
CSV
1
KPI
CSV
2
Map Drilldown
GeoJSON
1
Map
GeoJSON, CSV (for filters)
12
VideoWall
CSV
1
Word Cloud
CSV
1
Timeline
CSV
1
Advanced Chart
CSV, JSON
1
FloorMap
JSON
20
Web Component
JSON
1
If you need to, you can edit the data source by clicking the Edit icon
 next to the Data Source box.
For the FloorMap widget, you can click on the
 icon to view the format that the dataset should be in, which is shown in the screenshot below.
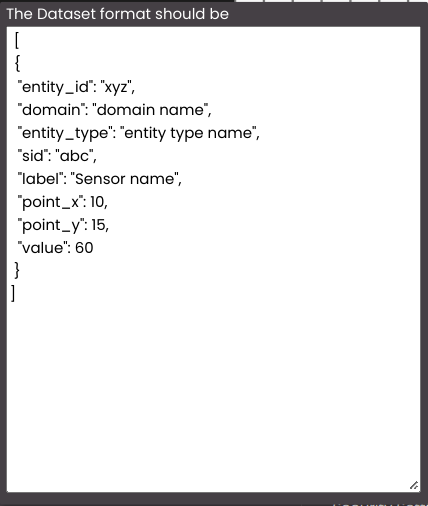
If the Request Parameters drop-down panel appears on the right-hand side, you must supply parameters to the data source to enable the widget to display information. Click Request Parameters.
Enter the default values for the parameters. These are the values that will be passed to the data source when the widget loads data for the first time.
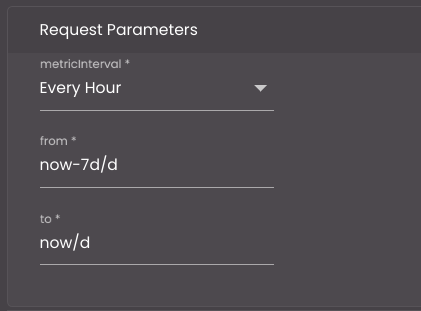
Click Submit.
The preview pane in the upper half of the dialog box is updated with information from the data source.
Click Data Refresh Settings. In the Custom Events box, select the event(s) on which the information from the data source should be updated. The default events are as follows:
MAP_ENTITY_CLICK The user clicks a marker on a map widget.
DASHBOARD.REGION_CHANGE_EVENT The user selects a different Region from the Region filter.
DASHBOARD.DATE_RANGE_CHANGE_EVENT The user selects a different time period from the Date filter.
TABLE.SELECT_ROW_EVENT The user selects a row in a datagrid widget.
DASHBOARD.LANG_CHANGE_EVENT The user selects a different language from the Language drop-down at the top of the main screen.
However, this is currently not supported in the map widget.
DASHBOARD.GENDER_CHANGE_EVENT The user selects a different gender from the Gender filter.
DASHBOARD.AGE_RANGE_CHANGE_EVENT The user selects a different age range from the Age Range filter.
DASHBOARD.GRANULARITY_CHANGE_EVENT The user selects a different granularity from the Granularity filter.
Note that to enable MAP_ENTITY_CLICK or TABLE.SELECT_ROW_EVENT to work, you must also set up a corresponding Action in the map or datagrid widget to trigger this event. See Configure map widget actions or Configure datagrid widget columns.
The Mappings boxes indicate the parameters that are passed when an event occurs. They are already populated with the names of the parameters whose values are needed by the data source.
To enable the dataset to be updated at a regular frequency, select the Time check box and enter the time after which the dataset should be updated.
To disable the initial loading of data, select the Disable initial load check box so that only the dataset data will be loaded. This will improve the performance. However, this should be enabled only when one widget data changes depending on another widget data selection ie; parent-child widgets. Also, this is currently not supported in the map widget.
To enter a custom text to show before the widget is fully configured, enter it in Custom widget message.
Additionally, click Security Settings. In the Select Domain drop-down, select any of the domain that was created in the Definitions->Domains section. The widget created for the domain selected will be accessible only for the role to which it is assigned. For example, a Parking Widget can be accessed by only the parking operator and the default operator.
Note
In order to configure the nested layers in a Map widget, it is required to select the domain from the Select Domain drop-down in the Security Settings panel.
Click Update.
You can add further datasets only for the Data Selector, KPI, Map, HTML and FloorMap widgets. For example, if you're configuring a map widget that includes several layers of information, you may need to add a dataset for each layer. To do this, click New Dataset.