Historical route marker movement in a map widget
You can track the historical vehicle movement to understand and analyze where, when and how the vehicle moved or stopped. You can also control the speed of movement of the vehicle using the track panel.
Enable Historic Track Panel and ensure the desired icon and track configuration is selected in the Features tab.
Note
The selected icon and track configuration will be applied to all the layers.
Refresh the dashboard if this Historic Track Panel is toggled for better results.
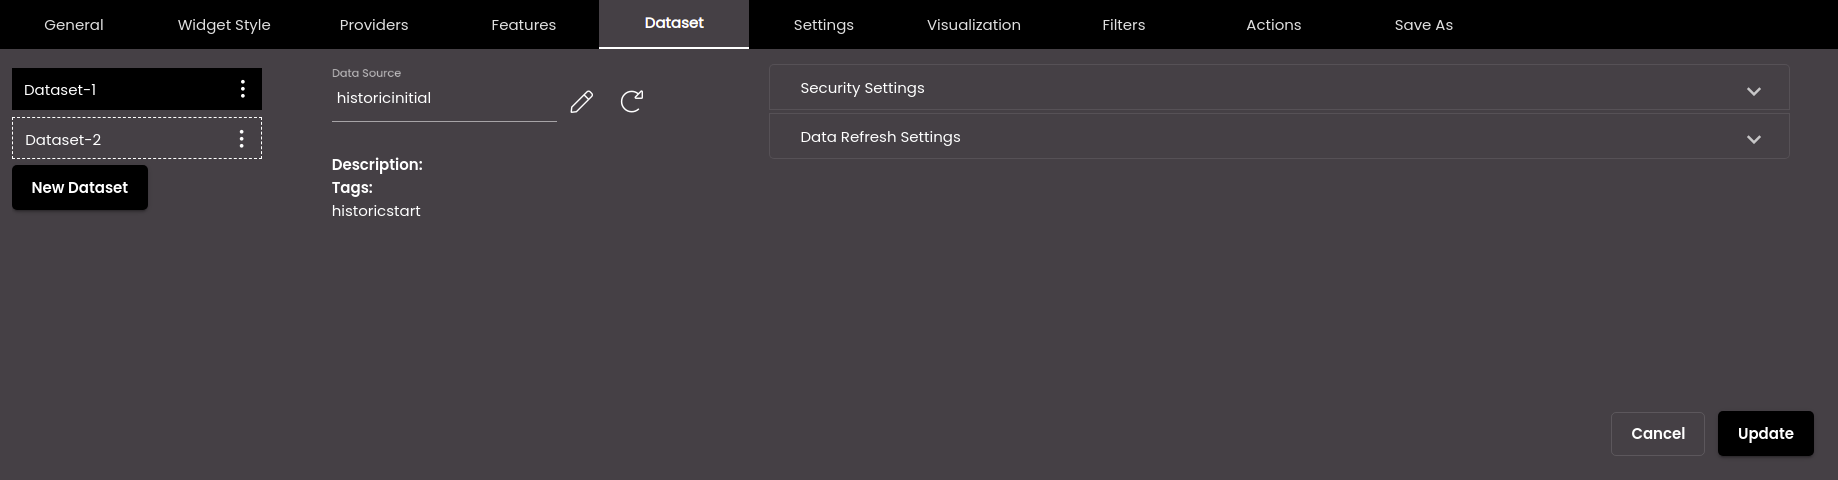
During dataset creation, the Tags field has to be the text historicstart so that it is displayed in the Dataset tab to view the live or initial data of the markers. For more information, see Create a dataset. Also, Request Parameters can be set to to accept the vehicle details using dynamic variables for e.g: vehicle number, from and to date, the vehicle journey's start and end points, and the historical path as inputs.
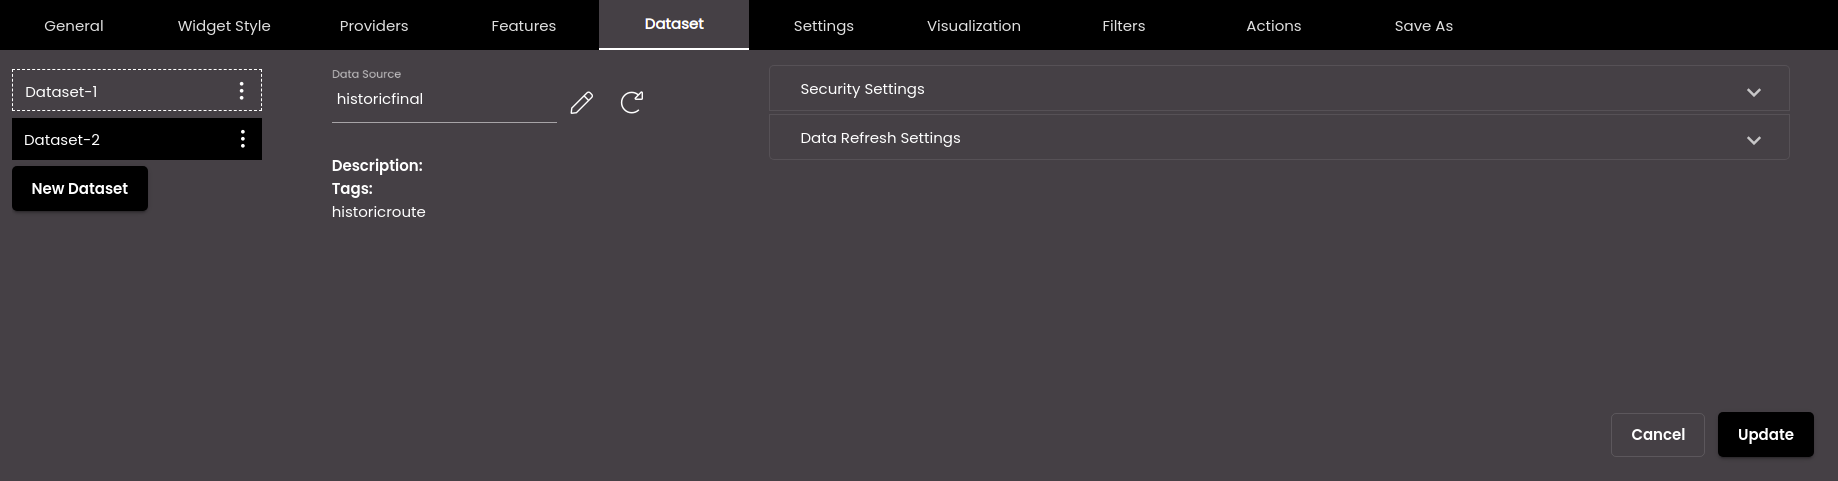
Select another dataset in the Dataset tab that contains the historical route information. This dataset will be called the Historic Route Dataset in the Settings tab and will be used to show the historical route of the marker. Also, during dataset creation, the Tags field has to be the text historicroute so that it is displayed here to view the historical route of the markers. For more information, see Create a dataset. Also, Request Parameters can be set to to accept the vehicle details using dynamic variables for e.g: vehicle number, from and to date, the vehicle journey's start and end points, and the historical path as inputs to play the route of a particular vehicle(s).
Note
The Historic Route Dataset should be in the following format and contain the following attributes as illustrated below. It mainly needs to contain the keys
lat,lng,timeand a unique id. Any unique id can be used in place of thevehicleidkey.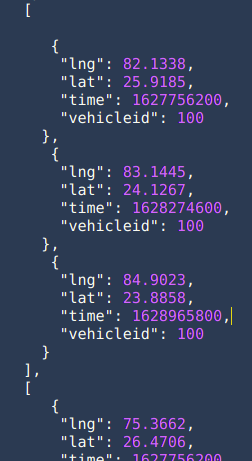
Also, other keys with any related vehicle info can be added as well. A key
infoneeds to be created as an array and the details can be added in it as illustrated below.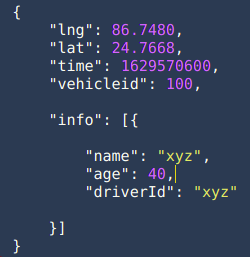
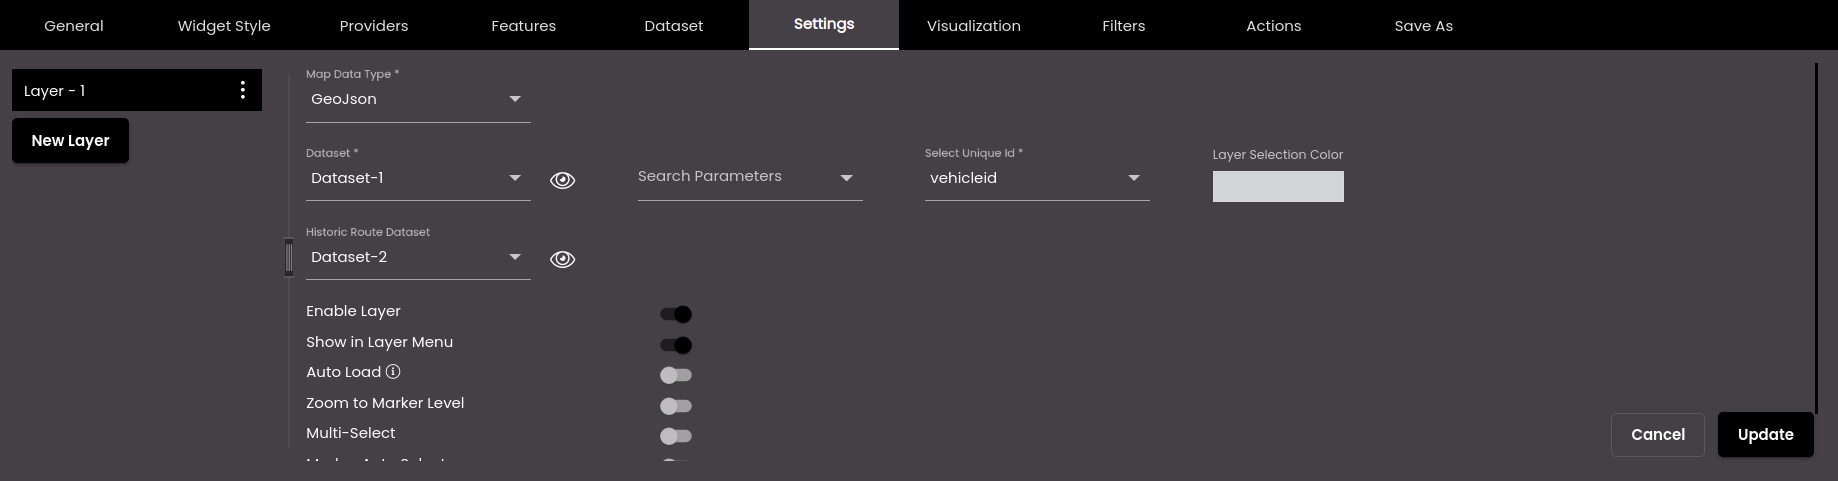
Configure the map widget settings in the Settings tab as mentioned earlier. Apart from the previous settings there is the additional setting Historic Route Dataset which is the second dataset which contains the historical route information.
Configure the rest of the settings in the map widget as described earlier.
Once you have configured all the above settings you are ready to view the historical route marker movement on the map.
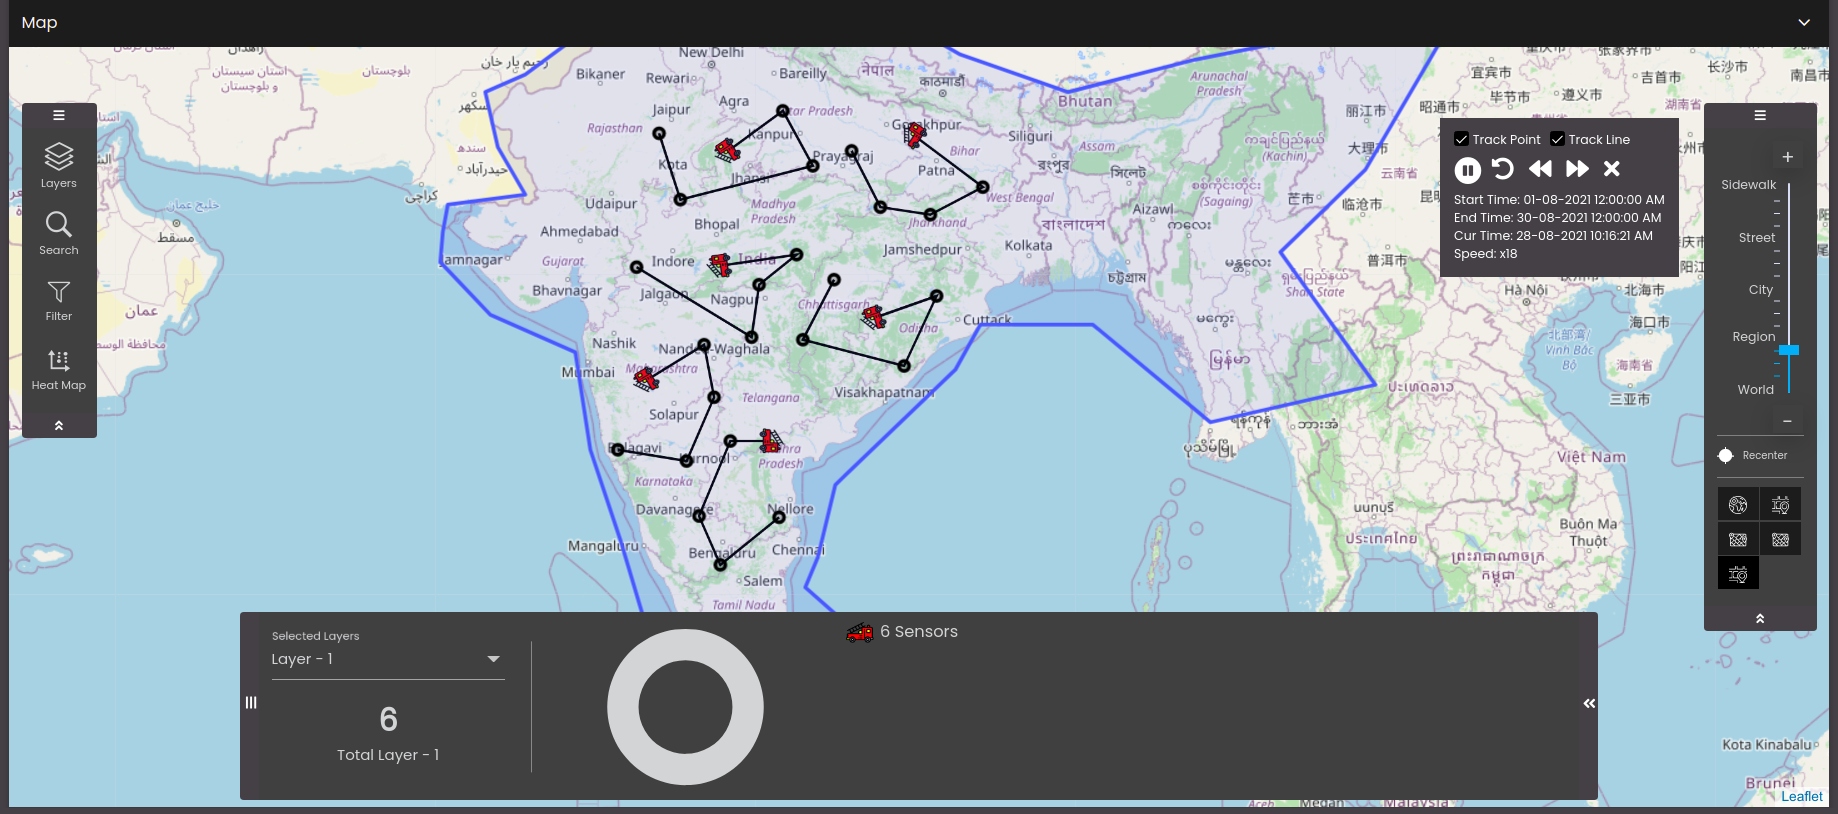
There is a historic track panel that is displayed on the top right hand corner of the widget. It has some control buttons which enable the user to perform specific actions. The following are the options available to control the movement of the marker and display the associated information.
Select Track Point to display the track points in the path of the marker.
Select Track Line to display the track lines in the path of the marker.
Click
 to play the historical route movement of the markers.
Note
If you Search or Filter while the historical route of the markers are being played, a confirmation dialog is displayed asking if you want to stop the playback.
Click
 to pause the historical route movement of the markers.
Click
 to replay the historical route movement of the markers.
Click
 to decrease the playback speed thus making the historical route movement of the markers slow.
Click
 to increase the playback speed thus making the historical route movement of the markers fast/quick.
Click
 to recreate the historic track panel from start.
The Start Time is the time of the first movement of the marker(s).
The End Time is the time when the movement of the marker(s) has stopped.
The Cur Time is the current time of the historical route movement of the markers.
The Speed is the playback speed of the markers.
Note
The default speed is x10. The minimum is x1 and the maximum is x24.
The properties of the live data dataset is populated in the track point pop-up information dialog. You can choose which properties to display by selecting/deselecting them in the Information panel in the Actions tab and this is layer specific.